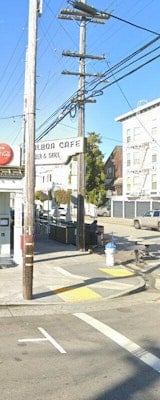
One of Hoodline’s editors lives on Oak Street, a heavily trafficked thoroughfare, and he's noticed that his window sills are always covered in some kind of black soot. Which got us wondering: Is that a tangible result of air pollution caused by the cars endlessly streaming past his building?
More importantly, should he be worried?
According to the SF Indicator Project, a San Francisco Department of Health website that provides data on a number of neighborhood health issues, 3.3 percent of San Franciscans live in an area where air pollution creates a cancer risk greater than or equal to 100 cases in 1 million people.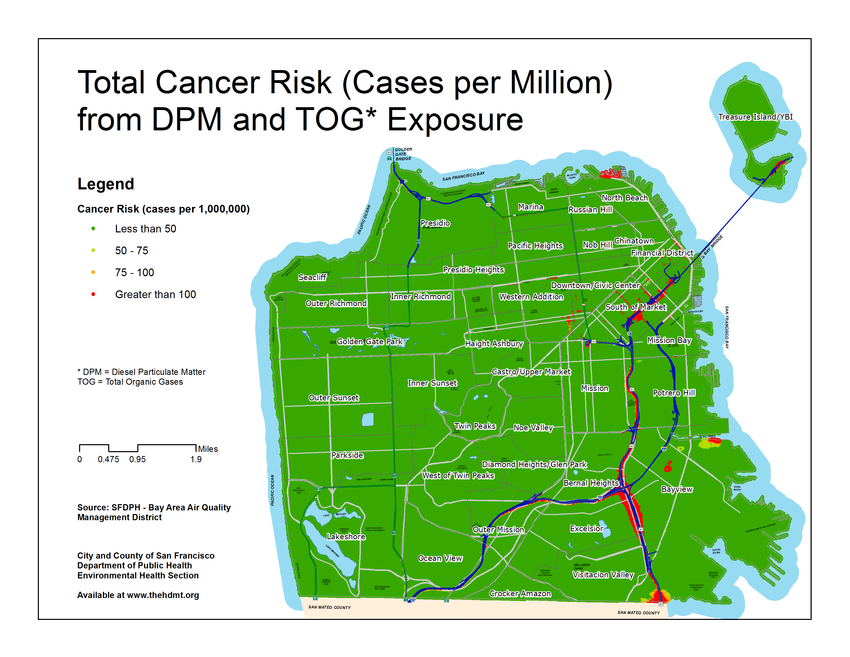 But some San Francisco neighborhoods bear an inordinate amount of that burden. About 28 percent of Mission Bay and SoMa residents live in an area with elevated cancer risk, while the same can be said of nearly 17 percent of those who call the Financial District home. Other at-risk neighborhoods include the Western Addition (almost 9 percent, including, perhaps, our editor) and the Bayview, Downtown/Civic Center, and the Excelsior (closer to 5 percent).
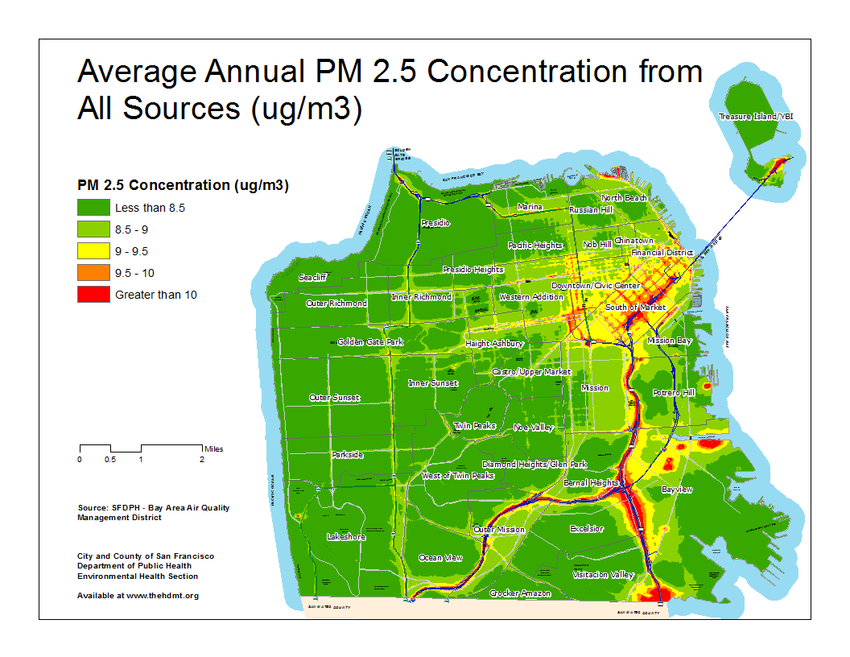 In the majority of San Francisco neighborhoods, zero percent (or close to it) of residents live in an area with high cancer risks due to air pollution.
Here is an “Air Pollutant Exposure Zone” map., below, created by the Department of Health and the Bay Area Air Quality Management District (BAAQMD) to show which parts of town have higher concentrations of air pollutants:
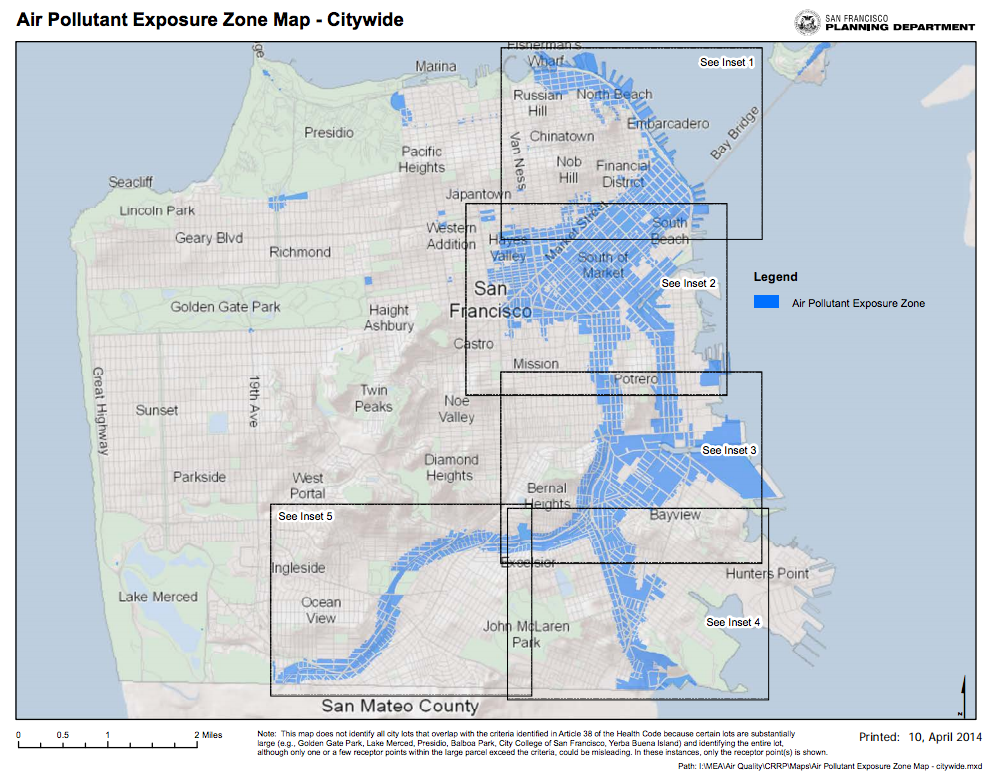
As you can see from the map, parts of Oak Street are indeed considered to be in an area of exceptionally high air pollution. If you, too, live in one of these areas, your first question might be about whether or not it’s your responsibility or your landlord’s (assuming you rent) to take precautionary measures. The answer is that it depends when your building was built.
In a joint statement, the Department of Health’s June Weintraub, an acting manager in the Environmental Health Branch, and Meg Wall Shui, a senior epidemiologist who also maintains the SF Indicator Project website, told Hoodline:
“In 2008, San Francisco Health Code Article 38 was adopted to require new residential construction projects located in areas where models show poor air quality and pollution from roadways must install enhanced ventilation to protect residents from the respiratory, heart, and other health effects of living in a poor air quality area.”
If your building was built before 2008, or you just want to arm yourself with all the facts you can, the SF Indicator Project is a great place to start. You can look up how your neighborhood performs in terms of eight different community health indicators (Environment, Transportation, Community, Public Realm, Education, Housing, Economy, and Health), and even drill down to neighborhood-level statistics on air quality.  “We encourage members of our community to use the data on SFIP to explore the various assets and challenges that their neighborhood may have and to become engaged in efforts to improve conditions; whether that be speaking to their local policy maker about their concerns, engaging in health promoting behaviors like walking rather than driving, or becoming engaged in neighborhood groups,” Weintraub and Shui say.
The most at-risk parts of the city are those gathered around freeways and other high-traffic areas, says Aaron Richardson, who works in the communications and outreach office for the BAAQMD, which is charged with regulating air pollution from stationary sources, like power plants. But it’s the mobile sources of air pollution San Franciscans need to be most worried about, he says. Our cars and trucks are a major source of benzene and other air pollution as well as fine particulates.
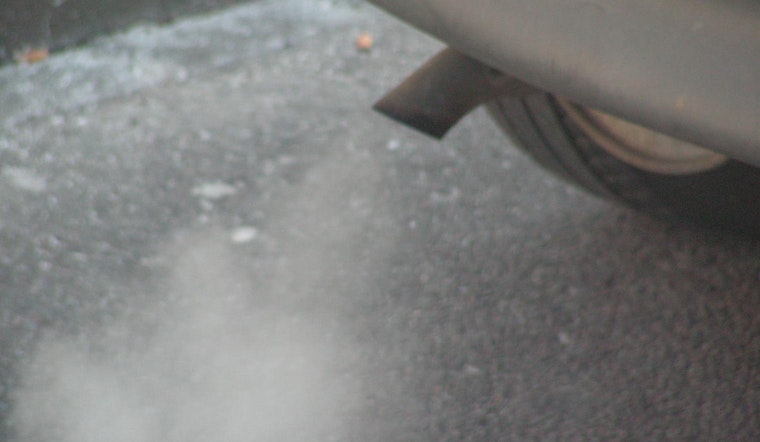
“We know there are health impacts from traffic,” Richardson tells Hoodline. “Diesel exhaust has been identified as a serious health concern in our communities, they think it’s responsible for 70 to 80 percent of cancer risk from traffic.” He also lists increased incidence of asthma and restricted lung capacity as other common maladies, noting that the risks are elevated for anyone living within 500 to 1000 feet of a freeway. (See top two maps.)
Richardson says that the soot on our editor’s window sill is likely caused by traffic on Oak Street, but the soot itself is not the greatest danger. “It’s the really small particles, 0.25 microns, smaller than human hair, that are really harmful. [The soot] is an indication the smaller particles might be present.” He suggests anyone living near a thoroughfare like Oak keep their windows facing the street closed during peak hours, and consider getting a HEPA air filter.
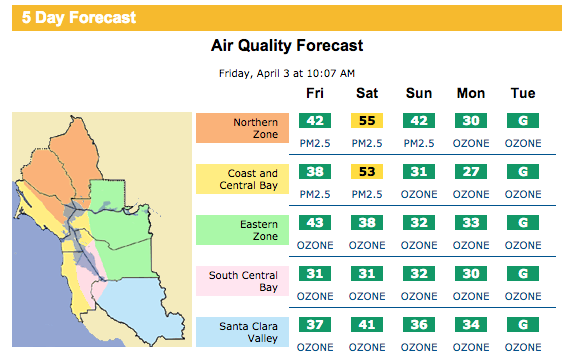
The latest Bay Area Air Quality District air quality forecast, from Friday.
If you’re really worried about your exposure to air pollution, you might want to check the Air Quality Forecast on the Spare the Air site regularly and, when it’s a Spare The Air Day (there have already been several this year), refrain from heavy exercise or other outdoor activity, even if you’re relatively healthy.
There is, of course, an environmental and social justice angle that needs to be considered when discussing air quality in San Francisco,. A 2007 study called "Still Toxic After All These Years" released by the Center for Justice, Tolerance & Community at UC Santa Cruz found that African Americans are three times more likely to live within one mile of a source of toxic air pollution than are white San Franciscans, while Latinos are more than twice as likely and Asians are “slightly more likely.” The report also found that closer proximity to sources of air pollution and lower incomes were closely correlated.
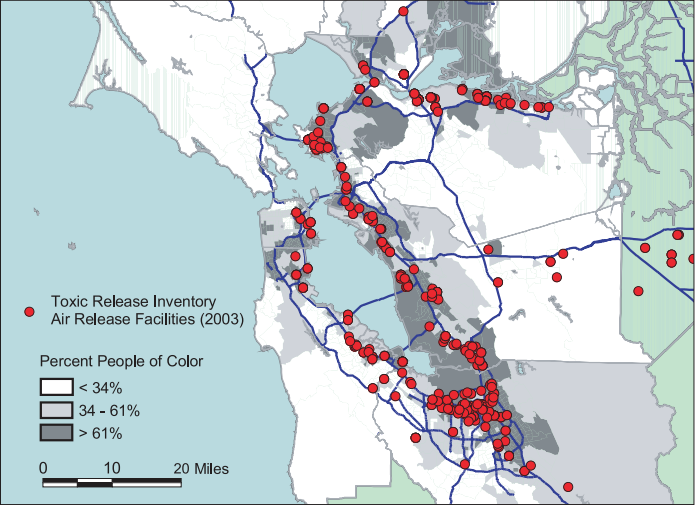
Locations of Facilities with Air Releases (as Recorded in the ToxicRelease Inventory or TRI) Relative to Neighborhood Demographics in the 9-CountyBay Area, via the CJTC report.
Air quality city-wide drastically improved with the closure of both of San Francisco’s major stationary sources of air pollution: the coal-fired Hunter’s Point Power Plant, which shut down in 2006, and the natural gas- and diesel-burning Potrero Generating Station, which ceased operating in 2010.
But a quick parsing of SF Indicator Project data shows that the neighborhoods with the worst air quality all have a higher percentage of low-income households than the San Francisco average of 26 percent (in this case, “low-income” is measured as less than 200 percent above the poverty line). In the Bayview, for example, some 39 percent of households are low-income. Here’s the percentage of low-income households in each of the other neighborhoods mentioned above as having elevated risk of cancer from air pollution: Downtown/Civic Center (55 percent), Excelsior (28 percent), Financial District (34 percent), Mission Bay (30 percent), SOMA (44 percent), Western Addition (31 percent).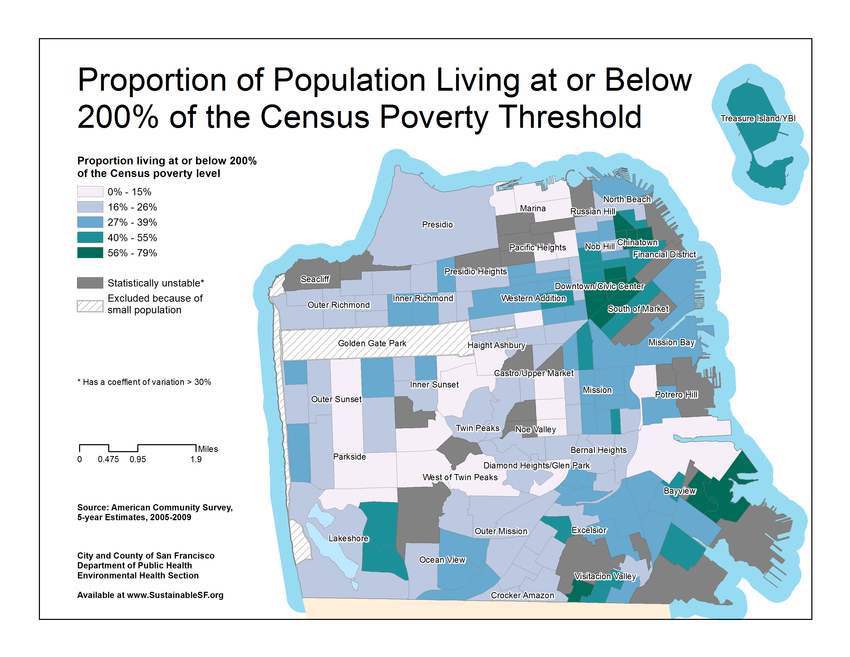 All of these neighborhoods are close to highways or other high-traffic corridors and have elevated levels of fine particulate matter pollution, according to SFIP.
Overall, though, the BAAQMD’s Richardson says most San Franciscans have it relatively good. “We’re pretty lucky that we have strong ocean breezes that ventilate the city pretty well, so we don’t have the kinds of air problems that you see in the Central Valley, or the Sacramento area, or Los Angeles.”
All maps above via the SF Indicator Project unless otherwise noted. Be sure to check out the site for all sorts of additional information.