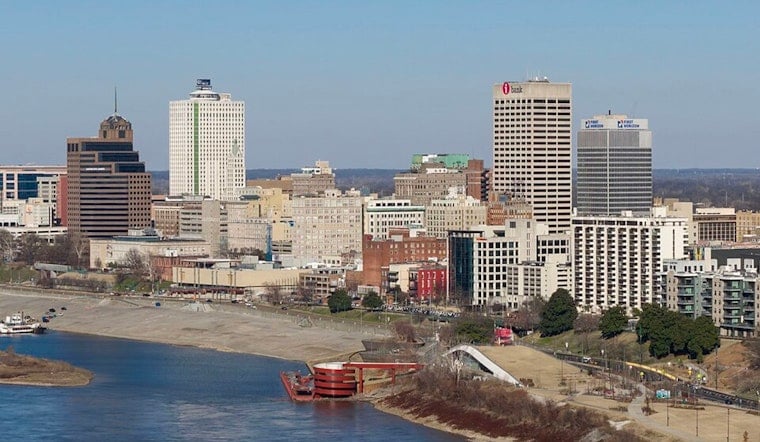
Last summer, Memphis volunteers turned their cars into mobile weather stations and proved what a lot of locals already suspected: some neighborhoods are cooking. The one-day, community-run Heat Watch campaign clocked a high of 102°F and found roughly a 14.4°F gap between the hottest and coolest parts of the city. Over the course of the day, 78 volunteers strapped sensors to vehicles and collected more than 131,000 measurements along 18 routes covering about 200 square miles, tracing both brutal hot spots and cooler, tree-shaded refuges. All of it is playing out against a steep local energy burden that leaves many households exposed to both health and financial strain when temperatures spike.
How the Campaign Mapped Memphis Heat
On July 23, 2025, community data collectors drove pre-planned routes in the morning, afternoon and evening to track ambient air temperature and relative humidity. CAPA Strategies then modeled the data to create high-resolution maps of ambient temperature and heat index that zoom all the way down to the street level, filling in gaps that satellite imagery often misses. The effort was also meant to build local capacity for future monitoring, not just produce a one-off snapshot. The interactive map and full report are posted online, according to the Shelby County Office of Sustainability and Resilience.
Where It Is Hottest - And Coolest
The modeled results show heat clustering in heavily built-up parts of Downtown, around Memphis International Airport and along major commercial corridors including Poplar Avenue, Jackson Avenue, Summer Avenue, Lamar Avenue and East Shelby Drive. In contrast, heavily tree-canopied areas such as Overton Park stayed noticeably cooler during the measurements. Those hot and cool splits, shaped by impervious surfaces, industrial uses and sparse tree cover, show up clearly on the new heat maps and in local reporting. The Memphis Flyer reviewed the findings and the report’s maps.
Why It Matters For Health And Wallets
The regional Mid-South Climate Action Plan, read alongside the Heat Watch data, lays out the stakes in plain numbers. The plan finds that the average Memphis household spends about 6.2% of its income on energy, compared with roughly 3.5% nationally, while low-income households can see that share climb to 25% or more. It also documents 18 fatalities in the Memphis metropolitan area directly attributed to extreme heat since 2010 and warns that urban heat islands make conditions even more dangerous for residents without reliable cooling. The Mid-South Climate Action Plan records those figures and calls for targeted interventions.
Local Partners And The Big Warning
“Extreme heat is the deadliest of all natural disasters, and its impacts fall unevenly across communities,” the Heat Watch report notes, emphasizing that where you live and what resources you have largely determine your risk. The campaign was coordinated by The Works, Inc., the University of Memphis and the City of Memphis, in partnership with CAPA Strategies and the Center for Collaborative Heat Monitoring. Organizers say the dataset is meant to help planners and community groups decide where trees, cooling centers and weatherization programs will have the greatest impact, according to the Shelby County Office of Sustainability and Resilience.
What The Report Recommends
Both the Heat Watch analysis and the Mid-South plan land on a similar set of fixes. At the top of the list: expand tree canopy and green infrastructure in the hottest neighborhoods, boost weatherization and energy-efficiency funding for low-income homes, and place cooling centers and key transit links where extreme heat and social vulnerability overlap. Those priorities sit at the core of the plan’s recommendations and are already guiding community groups that are using the Heat Watch outputs to support grant applications and tree-planting plans. For more on the broader campaign network and methodology, see the Center for Collaborative Heat Monitoring.
For Memphians, the takeaway is specific to the block level. The new maps make it easier to see which streets and neighborhoods shoulder the worst of summer heat and where investments in trees, home weatherization, and cooling infrastructure are likely to do the most good. The interactive map and full report remain online for anyone who wants to dive into the data, neighborhood by neighborhood.


