























































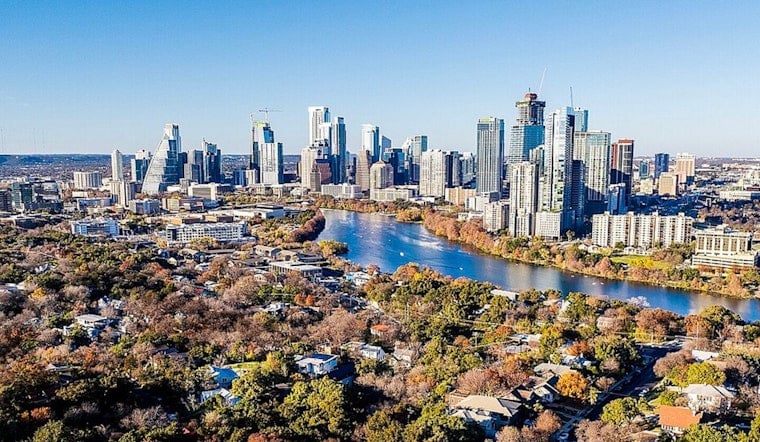
Fourteen years of census data show Austin splitting into two cities that happen to share the same zip codes. In Clarksville, per capita income climbed by $82,850 to reach $160,292, making census tract 12 the wealthiest in Austin. A few miles away in Tech Ridge, per capita income in tract 440 collapsed from $47,000 to $26,000 over the same stretch, and in some cases the city's richest and poorest tracts sit within walking distance of one another.
The numbers, first reported by the Austin American-Statesman, track average per capita income changes across Austin's census tracts between 2010 and 2024. Citywide, household incomes ranged from $69,000 to more than $151,000 depending on the tract, according to the newspaper's analysis. City Demographer Lila Valencia told the Statesman that the pattern is stark: “People who were already doing very well in 2010 are doing much better than in 2024.”
Valencia's explanation for the swings has less to do with raises and more to do with who is living where. She said newer families are moving into older homes and renovating them, and in Tech Ridge specifically, multifamily developments and apartment complexes replaced smaller single-family homes, reshaping tract 440's income profile. That mirrors what City Demographer Lila Valencia separately told CultureMap Austin in 2025 — that Austin's drastic tract-level income changes stem primarily from population replacement rather than existing residents getting wage bumps, as lower-income households leave for cheaper housing elsewhere while higher earners move in.
Wealth Concentrates in Some Pockets, Vanishes in Others
The pattern isn't limited to Clarksville and Tech Ridge. Near Zilker Park, tract 13.09 saw per capita income rise from $73,000 to $122,000 while also gaining housing units, population and residents with a college education, per the Statesman's reporting. West of South Congress, tract 13.12 added 300 housing units between 2010 and 2024 and saw per capita income more than double, from $52,000 to $129,000. Nearby tracts 6.05 and 6.06 also gained hundreds of additional housing units over the period.
Not every tract moved upward. Near the Texas Capitol, tract 7's per capita income fell from $106,000 to $88,000 since 2010. Tract 305 dropped $22,000 from a 2010 baseline of $105,000. And in Clover Hill, tract 24.46 lost about $11,700 in per capita income over the same span, according to the Statesman's data.
The single steepest decline citywide belonged to tract 346, where per capita income fell from about $67,000 in 2010 to about $40,000 — the largest per capita income drop in the city. Near UT's West Campus, tract 6.01 saw a 19% drop in average income since 2010, and the tracts surrounding West Campus have become some of Austin's lowest-income areas, with an average per capita income of just $5,679. Valencia attributed part of that decline to Concordia University's 2008 relocation of its main campus to northwest Austin, noting that lower-income students moving near the university's former West Campus grounds pull down the area's average income.
East Austin's Sharp Reversal
East of Interstate 35, tract 9.02 tells a different story: per capita income jumped 225%, from just over $20,000 to $68,000, even as the tract experienced an exodus of Black and Hispanic residents alongside a rising cost of living, the Statesman reported. In Austin's former Freedom Colony community, rising costs displaced Black residents who had lived there for decades, and new developments there have included a five-story mixed-use project valued at nearly $10 million.
Tract 24.23 saw one of the city's biggest per capita income increases, up more than $62,000, as older homes were renovated into modern properties that raised both home prices and the income levels needed to buy in. Median home prices in that tract jumped from $286,800 in 2021 to $411,000 in 2024, according to the Statesman's analysis. Redevelopment there raised per capita income even as it reshaped who could afford to live in the neighborhood.
That east-side transformation lines up with a 2018 University of Texas at Austin gentrification study, which identified the so-called Eastern Crescent — an area east of I-35 historically shaped by racial segregation — as the city's primary concentration of census tracts at high risk of residential displacement due to rising property values, according to research compiled by UT Austin researchers. Not every east-side story ran the same direction, though: in tract 440, affordable housing helped lower-income residents move into the area even as the tract's overall per capita income fell.
The Bigger Numbers Behind the Block-by-Block Story
Austin's highest-income brackets grew faster than every other bracket over the past decade, and the city as a whole saw the number of households earning $200,000 or more increase by 284% between 2010 and 2023, while households earning under $75,000 declined across every lower-income bracket, according to data compiled by the City of Austin. Median home sale prices in the city jumped 40% between 2014 and 2024, from $239,900 to $572,400, far outpacing the 21% growth in median household income over the same decade.
Those citywide gaps carry a racial dimension as well. The city's 2024 American Community Survey estimates show white median household incomes in Austin remain 1.6 times higher than Black households and 1.4 times higher than Hispanic households, with 54% of Black households and 40% of Hispanic households spending more than 30% of their income on housing. More recent one-year Census data, reported by SmartAsset, showed Austin's median household income actually slipped 1.17% between 2023 and 2024, settling at $90,430, while family median income fell 10.68% year-over-year to $125,672.
City officials have responded with policy changes aimed at the underlying housing math. The Austin City Council adopted the HOME Initiative in two phases, in December 2023 and May 2024, permitting up to three residential units by-right on single-family lots and lowering minimum lot sizes from 5,750 to 1,800 square feet, according to the National Association of Home Builders. In July 2024, the city's Housing Department also updated its Project Connect Anti-Displacement map, classifying census tracts into vulnerable, active and chronic displacement categories using UT Austin's Uprooted research framework to help direct voter-approved light-rail mitigation funds, as reported by The Daily Texan.
None of this is new territory for Austin. A 2015 analysis of Census tract data by Governing magazine, cited by Texas Housers, ranked Austin eighth nationwide in gentrification between 2000 and 2010, finding that nearly 40% of the city's eligible low-income tracts underwent rapid increases in home values and educational attainment. The latest tract-by-tract numbers suggest that trajectory hasn't slowed — it's just kept sorting Austin into wealthier and poorer pockets that, in some cases, are barely a block apart.