

























































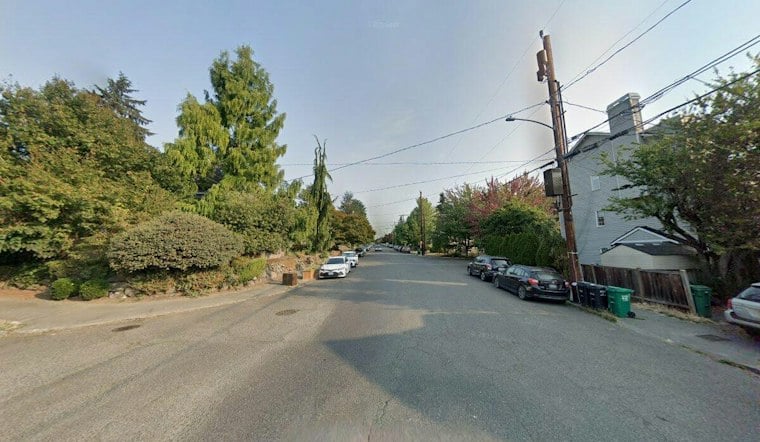
Residents on Woodland Park Avenue North are asking Seattle to add speed bumps after work this spring narrowed the street between North 42nd and North 43rd streets with striping and bollards. The request follows a petition residents started over the summer and leaves a key question for the city: what do measured speeds show after the changes? KOMO News reported that neighbors described some drivers traveling 40 to 50 mph on the avenue, where the posted limit is 20 mph. Those are residents’ observations, not published speed-study results.
The same report quoted longtime resident Marc Stiles as saying he had noticed drivers slowing on the narrowed stretch compared with before the project. It also said the Seattle Department of Transportation was measuring traffic speeds and volumes to evaluate the changes. KOMO did not publish those measurements or specify their collection dates, so the available account does not establish how speeds changed after construction—or whether the reported 40-to-50-mph driving continued afterward.
What the city’s process can tell residents
A speed-bump petition does not itself determine which treatment SDOT will use. The department says its Neighborhood Traffic Calming Program prioritizes locations for devices each year. It typically installs speed humps on residential streets and speed cushions on arterial streets, where buses and emergency vehicles can straddle them. That describes the city’s general approach, not a decision about Woodland Park Avenue or a commitment to install a device there. SDOT’s program guidance outlines those practices.
The timing and completeness of public data also matter. Seattle says its traffic-volume and crash-data dashboards are updated on an ongoing basis and may take up to a year to show all available data. That general notice does not say whether the measurements SDOT is collecting on Woodland Park Avenue will appear in those dashboards, or when. KOMO also reported that additional traffic-calming work beyond the approved project would require new funding.
A Seattle comparison, with limits
A documented Seattle example shows why measured results can help evaluate street changes, but it is not a forecast for Wallingford. In a May 2010 study of the Stone Way N rechannelization, SDOT reported that vehicles exceeding 40 mph fell by approximately 75%—from about 4% to 1% or less—while the 85th-percentile speed fell by about 1 mph northbound and 3 mph southbound. Stone Way’s lane-reduction project was different from Woodland Park Avenue’s narrowing, striping and bollards, so its results cannot establish what happened on the Wallingford block. The measurements SDOT is gathering there remain the most relevant evidence for judging the current project. SDOT’s Stone Way study documents that earlier comparison.