

























































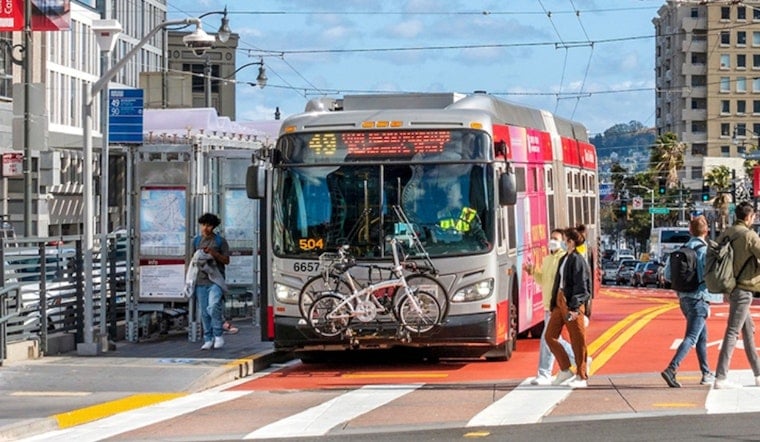
Caltrans District 4 has rolled out a first-of-its-kind Transit Needs Assessment (TNA) for the Bay Area, giving a clearer view of where upgrades like bus lanes, boarding islands and other transit-supportive infrastructure are likely to deliver the biggest payoff. The package pairs a short report with an interactive map that scores and tiers segments of the State Transportation Network across nine Bay Area counties. Planners say the analysis will help shape which state highway corridors are prioritized for projects that make buses faster, safer and easier to use.
The TNA identifies and tiers locations along the State Transportation Network where increased investment in transit-supportive facilities could be the most impactful, according to Caltrans District 4. The district frames the work as a companion to its Bay Area Transit Plan and the Caltrans Director’s Transit Policy (DP-40), intended to align state highway work with local and regional transit priorities. The project also points readers to a Complete Streets Transit Toolbox of recommended interventions, from signal priority to mobility hubs, that staff say will guide follow-up projects.
Explore the map and report
The interactive TNA map lets users zoom into corridors and see scores and tiering on the State Transportation Network; the map is viewable online from Caltrans. A concise TNA report with methods, scoring tables and examples was published in June 2026 and is available from the project's page. Together, the map and report give planners and advocates a starting point to target investments that improve transit reliability and access.
How corridors were ranked
Caltrans used a three-step scoring method that looked at travel-time variation, frequency, equity and alignment with regional priorities, then tiered segments so the top third are Tier 1 corridors, the middle third Tier 2 and the remainder Tier 3, the Caltrans report explains. The assessment draws on data provided by the Metropolitan Transportation Commission and local transit operators, supplemented with U.S. Census and OpenStreetMap sources. The authors flag data gaps where agency records varied and recommend partner engagement to refine and localize priorities before projects move to construction.
What this means for Bay Area transit
Regional agencies are already building complementary tools: the Metropolitan Transportation Commission adopted a transit-priority policy in January 2026 and is developing a Transit Priority Roadway Assessment that will produce a regional Transit Priority Network, according to MTC. Local operators such as AC Transit participated in data collection and outreach, underscoring that the TNA is meant to plug into programs like BusAID and other quick-build bus-priority efforts. For riders, the practical upshot is that state highway maintenance and improvement work may increasingly be coordinated with local transit upgrades to deliver faster, more reliable service.
Caltrans District 4 promoted the release in today's post on X, calling the TNA a first-of-its-kind for the Bay Area and pointing readers to the map and report for more details. The social announcement is one of several recent moves by state and regional agencies to prioritize bus speed and reliability across the region.
@CaltransD4 hasreleased the first-of-its-kind Transit Needs Assessment (TNA) as part of our Caltrans Bay Area Transit Plan👏👏🎉🎉! #publictransit #transit #bayarea
— Caltrans District 4 (@CaltransD4) July 17, 2026
View here: https://t.co/ZJloW2sfq0 pic.twitter.com/ypQle0UGy2
How to weigh in
Caltrans is soliciting feedback from transit agencies and the public and offers a sign-up and survey on its project page; for questions or to request materials, contact [email protected]. Planners and advocates who want to test the TNA's findings should start with the interactive map and the downloadable report to see how corridors in their communities were scored and where local projects could be most effective.