

























































Detroit shoppers spend a bigger share of their household income on groceries than residents of any other city in the country, according to a new ranking that places three other Midwest cities in the top 10 as well. A basic grocery basket in Detroit costs 4.03% of the city's median household income, the highest percentage among 100 of the largest U.S. cities analyzed.
The findings come from WOWO, which reported that WalletHub compared the cost of 26 common grocery items across 100 major U.S. cities and measured those costs against each city's median household income. Cleveland ranked second, with groceries eating up 3.93% of median household income, while Toledo came in fourth at 3.20% and Cincinnati landed at ninth with 3.05%. Rounding out the top 10 were Birmingham, Alabama, which ranked third at 3.45%, along with Newark, New Jersey; Baton Rouge, Louisiana; Buffalo, New York; Memphis, Tennessee; and Hialeah, Florida.
Why Low Incomes, Not High Prices, Drive the Rankings
It might seem like Detroit and Cleveland residents are simply paying more at the register than everyone else, but that's not quite what's happening. As Newsweek reported on WalletHub's broader 100-city analysis, Detroit and Cleveland topped the ranking largely because of depressed incomes rather than inflated shelf prices — Detroit had the second-lowest annual median household income in the study at $39,575, while Cleveland had the lowest at $39,187.
“Cities near the top of the ranking often face lower household incomes and relatively high prices for everyday grocery items,” said Chip Lupo, a WalletHub analyst, per WOWO's reporting. The dynamic helps explain why the same basket of 26 grocery staples can represent such a dramatically different burden depending on where a shopper lives, even when the sticker prices aren't wildly out of line with the national picture.
What Actually Shapes Regional Grocery Prices
Agricultural economics research indicates that regional price differences come down less to the cost of growing food and more to the cost of getting it onto shelves. Commercial retail rents, local labor costs, and delivery logistics drive most of the variation in grocery prices between metro areas, according to Purdue University agricultural economics professor Joseph Balagtas, as cited by The Cool Down.
That retail math only accounts for a sliver of what shoppers actually pay. Of every dollar Americans spent on domestically produced food in 2024, agricultural producers themselves received just 5.8 cents — 3.3 cents from livestock and 2.5 cents from crops — while foodservice captured 38.6 cents and retail and wholesale trade captured another 20.1 cents, according to the USDA Economic Research Service.
The Coastal Flip Side
The picture looks entirely different on the West Coast. California dominates the list of cities where groceries eat up the smallest share of median monthly household income, according to Visual Capitalist, which found Fremont at just 0.96% and San Jose at 1.16%, with San Francisco among seven California cities in the top 10 most affordable nationwide.
WOWO's reporting on the same WalletHub data found a similar pattern: Fremont, California, had the lowest grocery costs relative to median household income of any city studied, with its grocery basket representing just 0.91% of median household income. San Jose and San Francisco were also among the cities where groceries claimed the smallest share of local household budgets, underscoring how high coastal wages can offset otherwise steep costs of living.
A National Squeeze, Felt Unevenly
The gap between Rust Belt cities and coastal ones reflects a much larger national pattern in who feels food costs the hardest. Households in the lowest income quintile spent an average of 33.0% of their before-tax income on food in 2024 — $5,498 — compared to 12.2% for middle-income households and just 6.4% for the top quintile, according to USDA Economic Research Service data published in April 2026.
That strain shows up in how Americans say they feel about grocery bills. A nationwide AP-NORC survey found 53% of U.S. adults consider grocery costs a “major” source of financial stress in their lives, with another 33% calling it a “minor” stressor and only 14% saying it isn't a stressor at all, per the Associated Press. The same poll found that nearly 40% of Americans under age 45 have turned to short-term buy now, pay later financing to cover everyday essentials like groceries and restaurant meals.
Shoppers have also grown skeptical of how food companies manage pricing during inflationary stretches. A survey from Purdue University's Center for Food Demand Analysis and Sustainability found that 82% of grocery shoppers believe food manufacturers use shrinkflation — shrinking package sizes while holding prices steady — to boost profits, and 74% supported requiring companies to label products when sizes are reduced.
Pressure Reaches Detroit's Own Food Co-ops
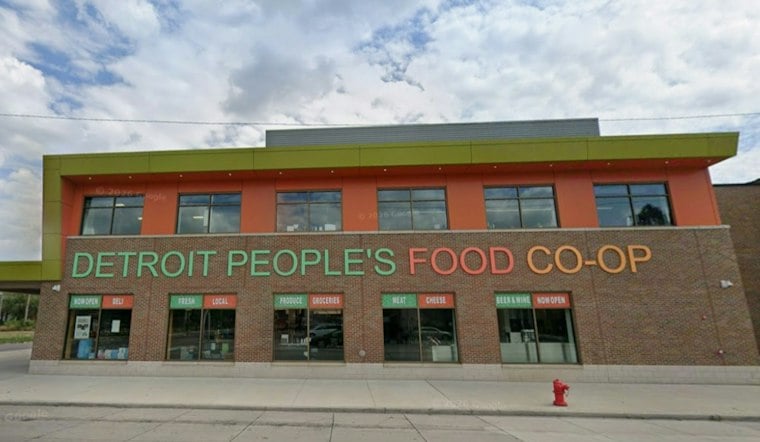
The budget strain documented in the WalletHub rankings isn't abstract for Detroit's food access organizations. Hoodline reported earlier this month that the Detroit People's Food Co-op in the North End issued an appeal to community members to help close a $20,000 weekly sales gap caused by rising operating costs and slow sales weeks.
Nationally, overall food spending hasn't followed the same trajectory as these local pressures. U.S. consumers spent 9.7% of their disposable personal income on food in 2025, actually down from 10.4% in 1997, even as total national food expenditures reached a record $2.51 trillion, according to USDA Economic Research Service data. The disconnect illustrates how a shrinking national average can still mask severe strain concentrated in lower-income cities like Detroit and Cleveland.
WalletHub's Advice for Stretching a Grocery Budget
For shoppers looking to manage their own grocery bills, WalletHub's report offered a handful of standard recommendations: build a budget before heading to the store, bring a grocery list, compare sales and coupons, consider store-brand products, and buy in bulk when it makes financial sense. The full report and city-by-city rankings are available online.