The city's Controller’s Office has released its annual report on the level of parks maintenance across the city, and the results are about the same as last year: according to internal audits, Districts 10 (Bayview/Dogpatch/Potrero Hill) and 11 (Excelsior/Ingleside/Oceanview) have the worst-maintained parks in San Francisco.
The report, based on data collected by the city's Recreation and Parks Department and the City Services Auditor, is a citywide evaluation of how well Rec & Park is maintaining San Francisco’s 200-plus parks, playgrounds and open spaces.
While the gap between the lowest and highest-scoring supervisorial districts shrank by 3 percent since last year’s report, there remains a sizable deficit between the best and worst of the seven Parks Service Areas that Rec & Park uses to divide maintenance duties between employees.
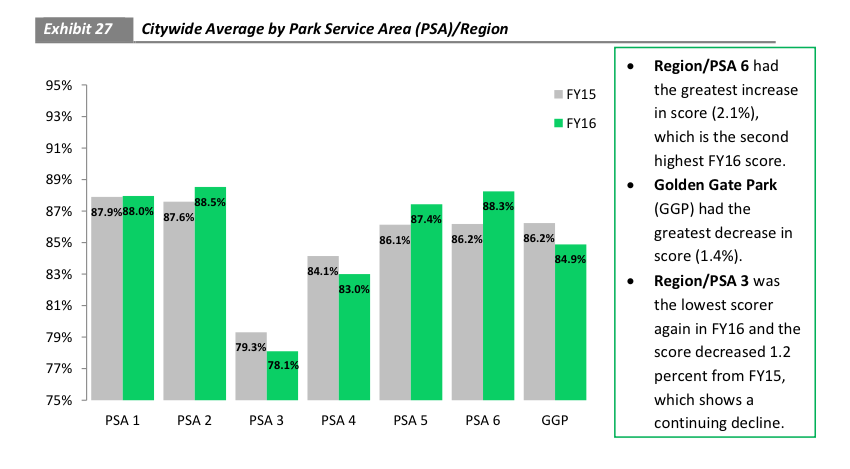
This year’s report shows that Parks Service Area 3, the maintenance area that covers most of Districts 10 and 11, is by far the lowest-rated of the seven service areas. (Here's a full list of all the parks and public open spaces in PSA 3.)
PSA 3’s scores were a full 10 percentage points below PSA 2, the highest-scoring area, which covers parts of downtown and SoMa.
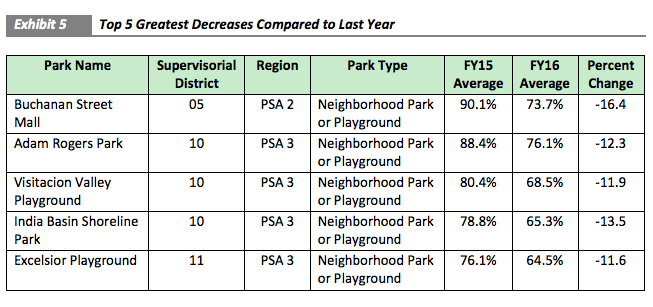
Four of the five parks with the largest decrease in scores since last year were also in Districts 10 and 11: Adam Rogers Park, Visitacion Valley Playground, India Basin Shoreline Park, and Excelsior Playground. Only one, Gilman Playground, made the list of the five most improved parks.
The city also ran the data to determine the ten best- and worst-maintained parks across San Francisco. While District 10 had two parks on the top-scoring list (Esprit Park and the 18th-Utah mini park, both in Potrero Hill/Dogpatch), parks in District 10 and District 11 made up fully half of the list of lowest-scoring parks.
District 11's Alice Chalmers Playground was the lowest-scoring park in the city, and the Bayview, Visitacion Valley, and Excelsior Playgrounds also made the bottom ten, along with District 10's India Basin Shoreline Park.
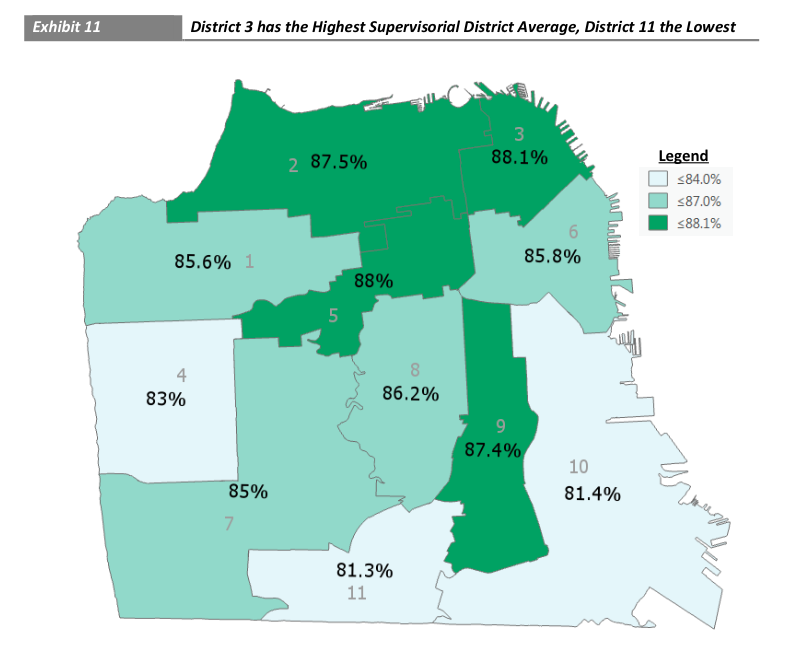
Lesser maintenance for parks in Districts 10 and 11 is nothing new: they've traded off for the city's lowest maintenance score every year since the Controller’s Office began publishing reports in 2005. This year, the two southern districts nearly tied for last place, with scores of 81.3 percent for District 11 and 81.4 percent for District 10.
The southern district’s scores split in only one regard. While District 11’s score increased by 2.5 percent over last year, District 10’s score decreased by 0.8 percent.
The maintenance report was published on October 25th, five days after the Parks Commission unanimously endorsed Rec & Park’s proposed equity metrics, a set of parameters required by Proposition B, the parks funding bond on the June 2016 ballot.
The metrics are meant to measure parks access across the city based on the income, unemployment and education level of the census tracts near certain parks.
The proposition also locks in parks funding by requiring the city to "allocate $64 million to the parks and open space fund in fiscal year 2016-17, with this baseline allocation increasing by $3 million each year for ten years, unless the city experienced a deficit of $200 million or more,” according to the controller’s report.
“[Prop B’s] baseline allocation could improve evaluated features that continually fail due to deferred maintenance issues,” the report notes.
In a letter included with the report, Rec & Parks general manager Phil Ginsburg focuses on the 3 percent decrease in the spread between the lowest and highest scoring supervisor districts, a “small improvement from last year in overall ratings." He also noted that 53 parks received scores above 90 percent, compared with 43 parks last year.


