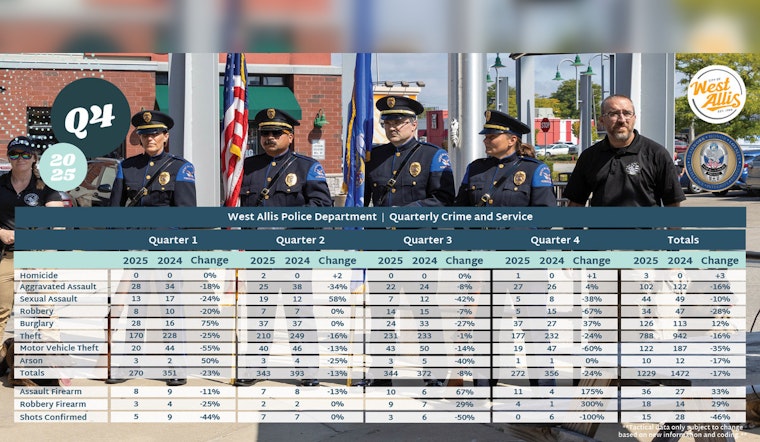
West Allis logged 1,229 Part 1 offenses across all reported 2025 quarters, about a 17 percent drop from 1,472 during the same period in 2024. City data shows most of that slide came from fewer thefts, motor-vehicle thefts and robberies, even as burglaries, arson and several firearm-related measures edged up. The 2025 tally also includes three homicides after none were recorded for the comparable 2024 period. All of the numbers come from the police department’s quarterly tables and public posts, and together they paint a picture of a city that is a bit safer on paper, with a few serious caveats.
Department Numbers, By The Book
According to a post by the West Allis Police Department, the quarterly breakdown shows motor-vehicle thefts down 35 percent, to 122 from 187, and overall thefts down about 16 percent, with 788 in 2025 compared with 942 in 2024. The same summary lists the combined Part 1 total of 1,229 for 2025 versus 1,472 for 2024 and frames the changes as early year comparisons drawn from the department’s quarterly reporting.
Gun Incidents And A Rare Homicide Uptick
The City of West Allis Crime Stats portal carries the department’s quarterly breakdown and a firearms table that point to a roughly 46 percent drop in confirmed shots fired, with 15 in 2025 versus 28 in 2024, even as assaults involving a firearm climbed about 33 percent to 36 incidents. The same set of tables shows robberies involving a firearm rising to 18 from 14, and records three homicides in 2025 after none in 2024, according to the City of West Allis Crime Stats.
Where Property Crime Moved
Property-crime trends were mixed. Burglary ticked up about 10 percent to 100 incidents and arson rose to 12 cases from nine, while overall robbery incidents fell to 34 from 47. Motor-vehicle theft was one of the sharper declines in the department’s tables, and the net effect was a drop in property-related Part 1 offenses that helped drive the overall decrease, according to the West Allis Police Department.
What Officials Say And How To See The Full Data
West Allis officials walked residents through the slides behind these numbers during neighborhood outreach earlier in 2025 and said they use the quarterly tables to shape patrol and prevention priorities. The city’s Crime Stats page hosts the full quarter-by-quarter tables and an interactive map for residents who want to review incidents by type and location, according to the City of West Allis Crime Stats.