















































New York City’s August housing market presented a narrow form of strength: StreetEasy reported that 21.8% of homes sold above their most recent asking price, the highest share since July 2022. But the citywide figure came alongside mortgage rates near 6.7%, a 5.0% annual decline in inventory to 15,324 homes and a 2.0% drop in the median asking price to $980,000.
The combination points to a selective market rather than a broad-based boom. Brooklyn recorded the highest borough share, at 31.9%, while Park Slope reached 61.3%—roughly three in five sales—and Greenwich Village reached 40.0%. Those neighborhood results show where competition was most concentrated, but they do not establish that every listing attracted multiple offers or that the same conditions extended across the city.
Competition is strongest where buyer attention is concentrated
Park Slope’s result is notable partly because it sits well above the citywide rate, yet the available evidence does not identify a single cause. StreetEasy’s proprietary Performance Pulse score was 73.5% for homes that sold above asking, compared with 55.8% for homes that sold at or below list. The measure is an indicator from StreetEasy, not an independent assessment of construction quality, location or neighborhood desirability. The same report associated strong listing performance with buyer attention, including saves and views, rather than with price cuts.
A separate Redfin analysis published August 4, 2026 named Park Slope the year’s hottest luxury neighborhood based on listing-view growth and Redfin’s Compete Score. That finding supplies related evidence of attention to the neighborhood’s luxury listings, but it does not show that all Park Slope homes were bidding-war properties or explain the 61.3% August sales share.
Limited supply raises the stakes without removing affordability constraints
Homes also moved somewhat faster in Brooklyn than a year earlier: the median time to contract was 69 days in August, three fewer than a year before, compared with 77 days citywide. At the same time, financing remained expensive. The estimated monthly payment on a median-priced New York City home with 20% down was $5,042, only 1.2% below a year earlier, while the national 30-year mortgage rate was about 6.66% in late August, according to Yahoo Finance.
That supply backdrop has a longer history. The New York City Comptroller’s Office reported that the inventory of homes available for purchase had declined steadily over the prior three years and was about at a seven-year low. The report provides context for August’s constrained selection, but it does not by itself show how many new listings, completed sales or total transactions occurred in August 2026 compared with earlier years.
Park Slope’s setting is documented, but not a proven explanation
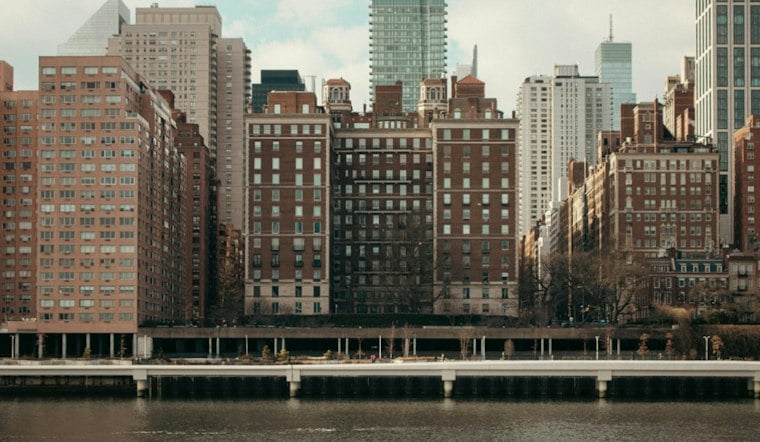
Park Slope’s physical character may help explain why the neighborhood is repeatedly discussed as a distinct market, though the available sources do not demonstrate a causal link to August’s above-asking sales. A New York City Landmarks Preservation Commission designation report describes development shaped by Prospect Park, early transportation routes and extensive masonry row-house construction. Those are observable characteristics of the neighborhood, not proof that historic districts, transit, schools, housing stock or development patterns produced the recorded bidding activity.
The current ownership market also has a limited historical precedent in New York’s rental market. Bloomberg reported in February 2022 that renters faced long lines, scarce apartments and bidding wars as a pandemic-era exodus reversed. That episode involved rentals and different economic conditions, so it cannot be used to measure today’s ownership market or establish that bidding wars are becoming more frequent.
For now, the clearest conclusion is narrower: scarce inventory and persistent borrowing costs are coexisting with intense competition for some well-positioned homes. August’s 21.8% citywide above-asking share marks a four-year high, but Park Slope’s 61.3% result is best read as evidence of concentration—not as proof of a citywide surge in demand or a single explanation for why buyers paid more.