























































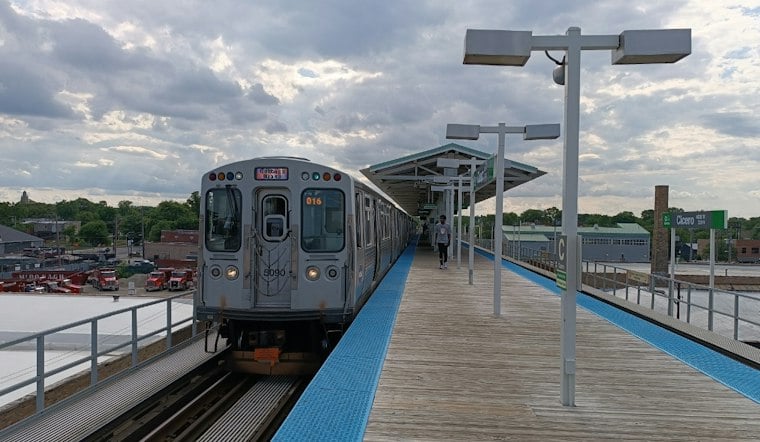
A new online tool is ranking Chicago Transit Authority stations by crime rates measured against how many people actually ride through them, and the Cicero stop on the Blue Line has come out on top as the city's riskiest station per 100,000 rides. The comparison, highlighted this week by FOX 32 Chicago, strips away raw crime counts in favor of a per-rider rate, a method that produces some surprising results across the CTA map.
Ridership, Not Just Raw Numbers, Drives the Rankings
According to FOX 32 Chicago, the new tool compares reported crimes with CTA station ridership figures to identify which stops carry the highest crime rates relative to how heavily they're used. That rider-adjusted approach is key to understanding the results: as Illinois Policy reports, Cicero on the Blue Line had the highest rate in the city when crimes are measured per 100,000 rides. The outlet's breakdown specifically examined the five CTA stations with the highest crime rates calculated that way, rather than simply tallying which stations logged the most incidents overall.
That distinction matters because, per the same report, the busiest stations did not necessarily have the highest crime rates. A station that moves tens of thousands of riders a day can still post a lower per-rider rate than a quieter stop if its raw crime count stays proportionally small — a dynamic that appears to be exactly what pushed Cicero to the top of the list.
Different Measure, Different Hotspots
The rate-based ranking is a departure from other recent looks at CTA crime data. Separate 2025 figures cited by the Chicago Sun-Times found that the train stops with the most aggravated attacks that year were Clark/Lake along with the Red Line stops at 63rd Street and Lake Street — a list built on raw incident counts rather than rates per ride. The two measures aren't contradictory, but they tell different stories about where danger concentrates versus where it's most common in absolute terms.
Any attempt to calculate rates per ride also has to account for a wrinkle in the underlying ridership data. The CTA's own ridership portal, rtams.org, notes that in March 2026 the agency restated its ridership figures retroactively back to January 2025, a revision that affects any rate calculation drawing on recent ridership counts. The portal displays daily average ridership by station for a given month and day type, giving analysts a basis for rate calculations even as the agency's own numbers shift underneath them.
A Broader Surge in Transit Violence
The new station tool arrives against a backdrop of rising transit violence. Per the Sun-Times report, aggravated assaults and batteries on the CTA reached at least a 24-year high in 2025, with the Chicago Police Department recording 469 such incidents that year compared with 441 in 2024. More than half of those attacks happened on trains and buses themselves rather than in stations, the paper reported, and the violence has only accelerated since: CTA aggravated assaults and batteries climbed 33% in 2026 compared with the same period the year before, according to the same account.
The geography of that violence has also shifted over time. The Loop now accounts for around 16% of CTA-related aggravated batteries and assaults in 2025, up sharply from about 5% of those crimes back in 2009, the Sun-Times found. At the same time, the CTA and Chicago Police Department have ramped up police deployments across the system during 2026, including additional uniformed officers posted at stations and riding trains, per Illinois Policy's reporting.
Mixed Signals From CTA's Own Numbers
CTA officials have pointed to improvement in some broader crime categories even as aggravated assault figures climb. The agency has reported an 8.5% drop in overall crime compared with the same period a year earlier, along with a 10% decline in rail crime and a 23% drop in violent crime across the bus system, according to the same Sun-Times report. Those citywide trendlines sit uneasily alongside the sharp rise in aggravated assaults and batteries, underscoring how differently crime data can read depending on which category and which measurement method — raw counts, rates per ride, or year-over-year percentage change — is used to tell the story.
Underlying all of these comparisons is data pulled from the Chicago Police Department's CLEAR system, which the city describes as reflecting reported incidents of crime occurring within Chicago during a specific time period, according to the City of Chicago's own crime data portal. For riders trying to make sense of where the CTA is safest, the new rate-based tool offers one more lens — though as the Cicero finding shows, it doesn't always point to the stations that get the most attention.