San Francisco has begun the year with a broad drop in crime, according to official reports, including property crimes and most violent crimes.
Unfortunately, the trend doesn’t extend to every neighborhood. Tips from readers and our reporting have hinted at an uptick in violent incidents in the first couple of months of 2017 around the Haight, the Castro, and surrounding neighborhoods.
To get a better sense of the trends, we analyzed the freshest, most detailed data source available—incident reports filed by the San Francisco Police Department and published by the city on the SF OpenData site.
The good news is that the city has been somewhat safer this year, notably in central city neighborhoods like the Tenderloin, according to our analysis.
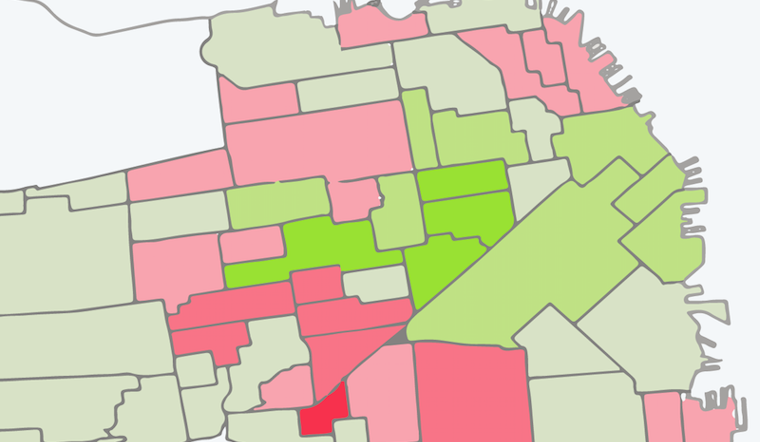
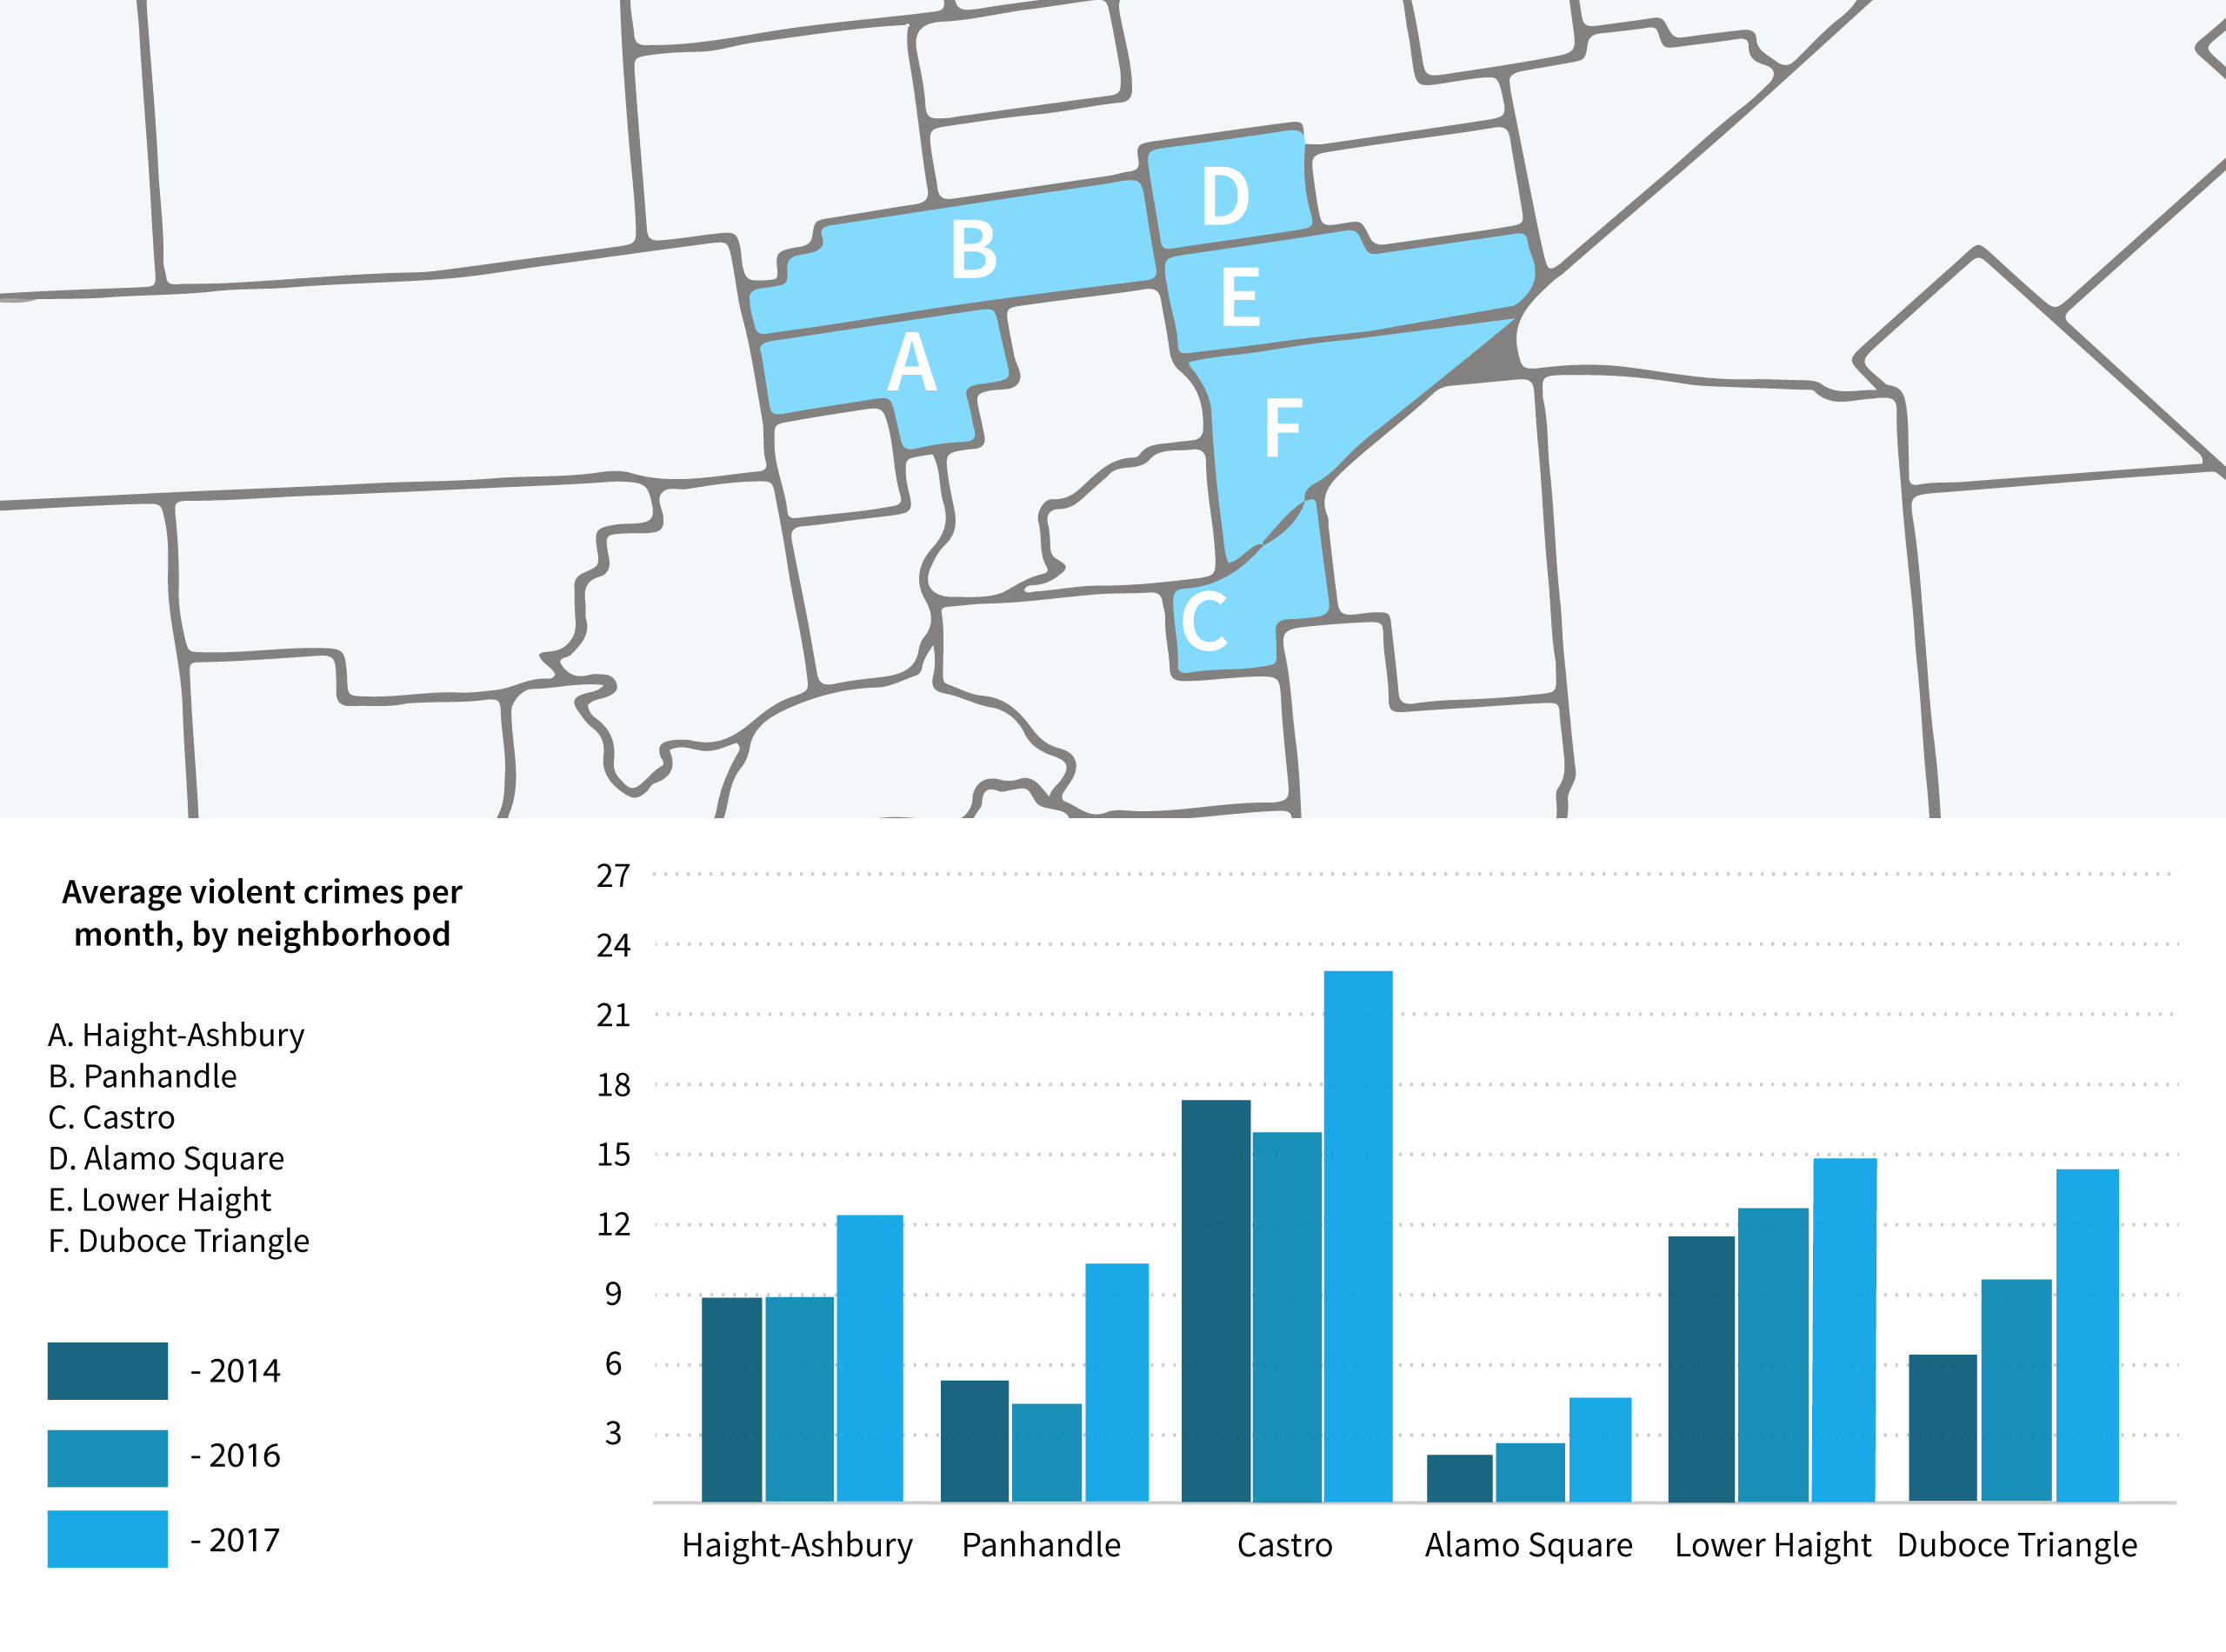
But the string of neighborhoods running from the western edge of Hayes Valley to Golden Gate Park have in fact seen violent incidents per month increase this year versus last.
We'll be following these trends in the coming months to find out more on the complicated causes and effects of city crime. For now, here’s a closer look at the numbers.
Good news, citywide
Over 60 percent of the 118 neighborhoods we looked at saw a decrease in violent crime, with a citywide decrease from around 13.2 incidents on average per neighborhood per month last year to 12.3 in the first two months of this year.
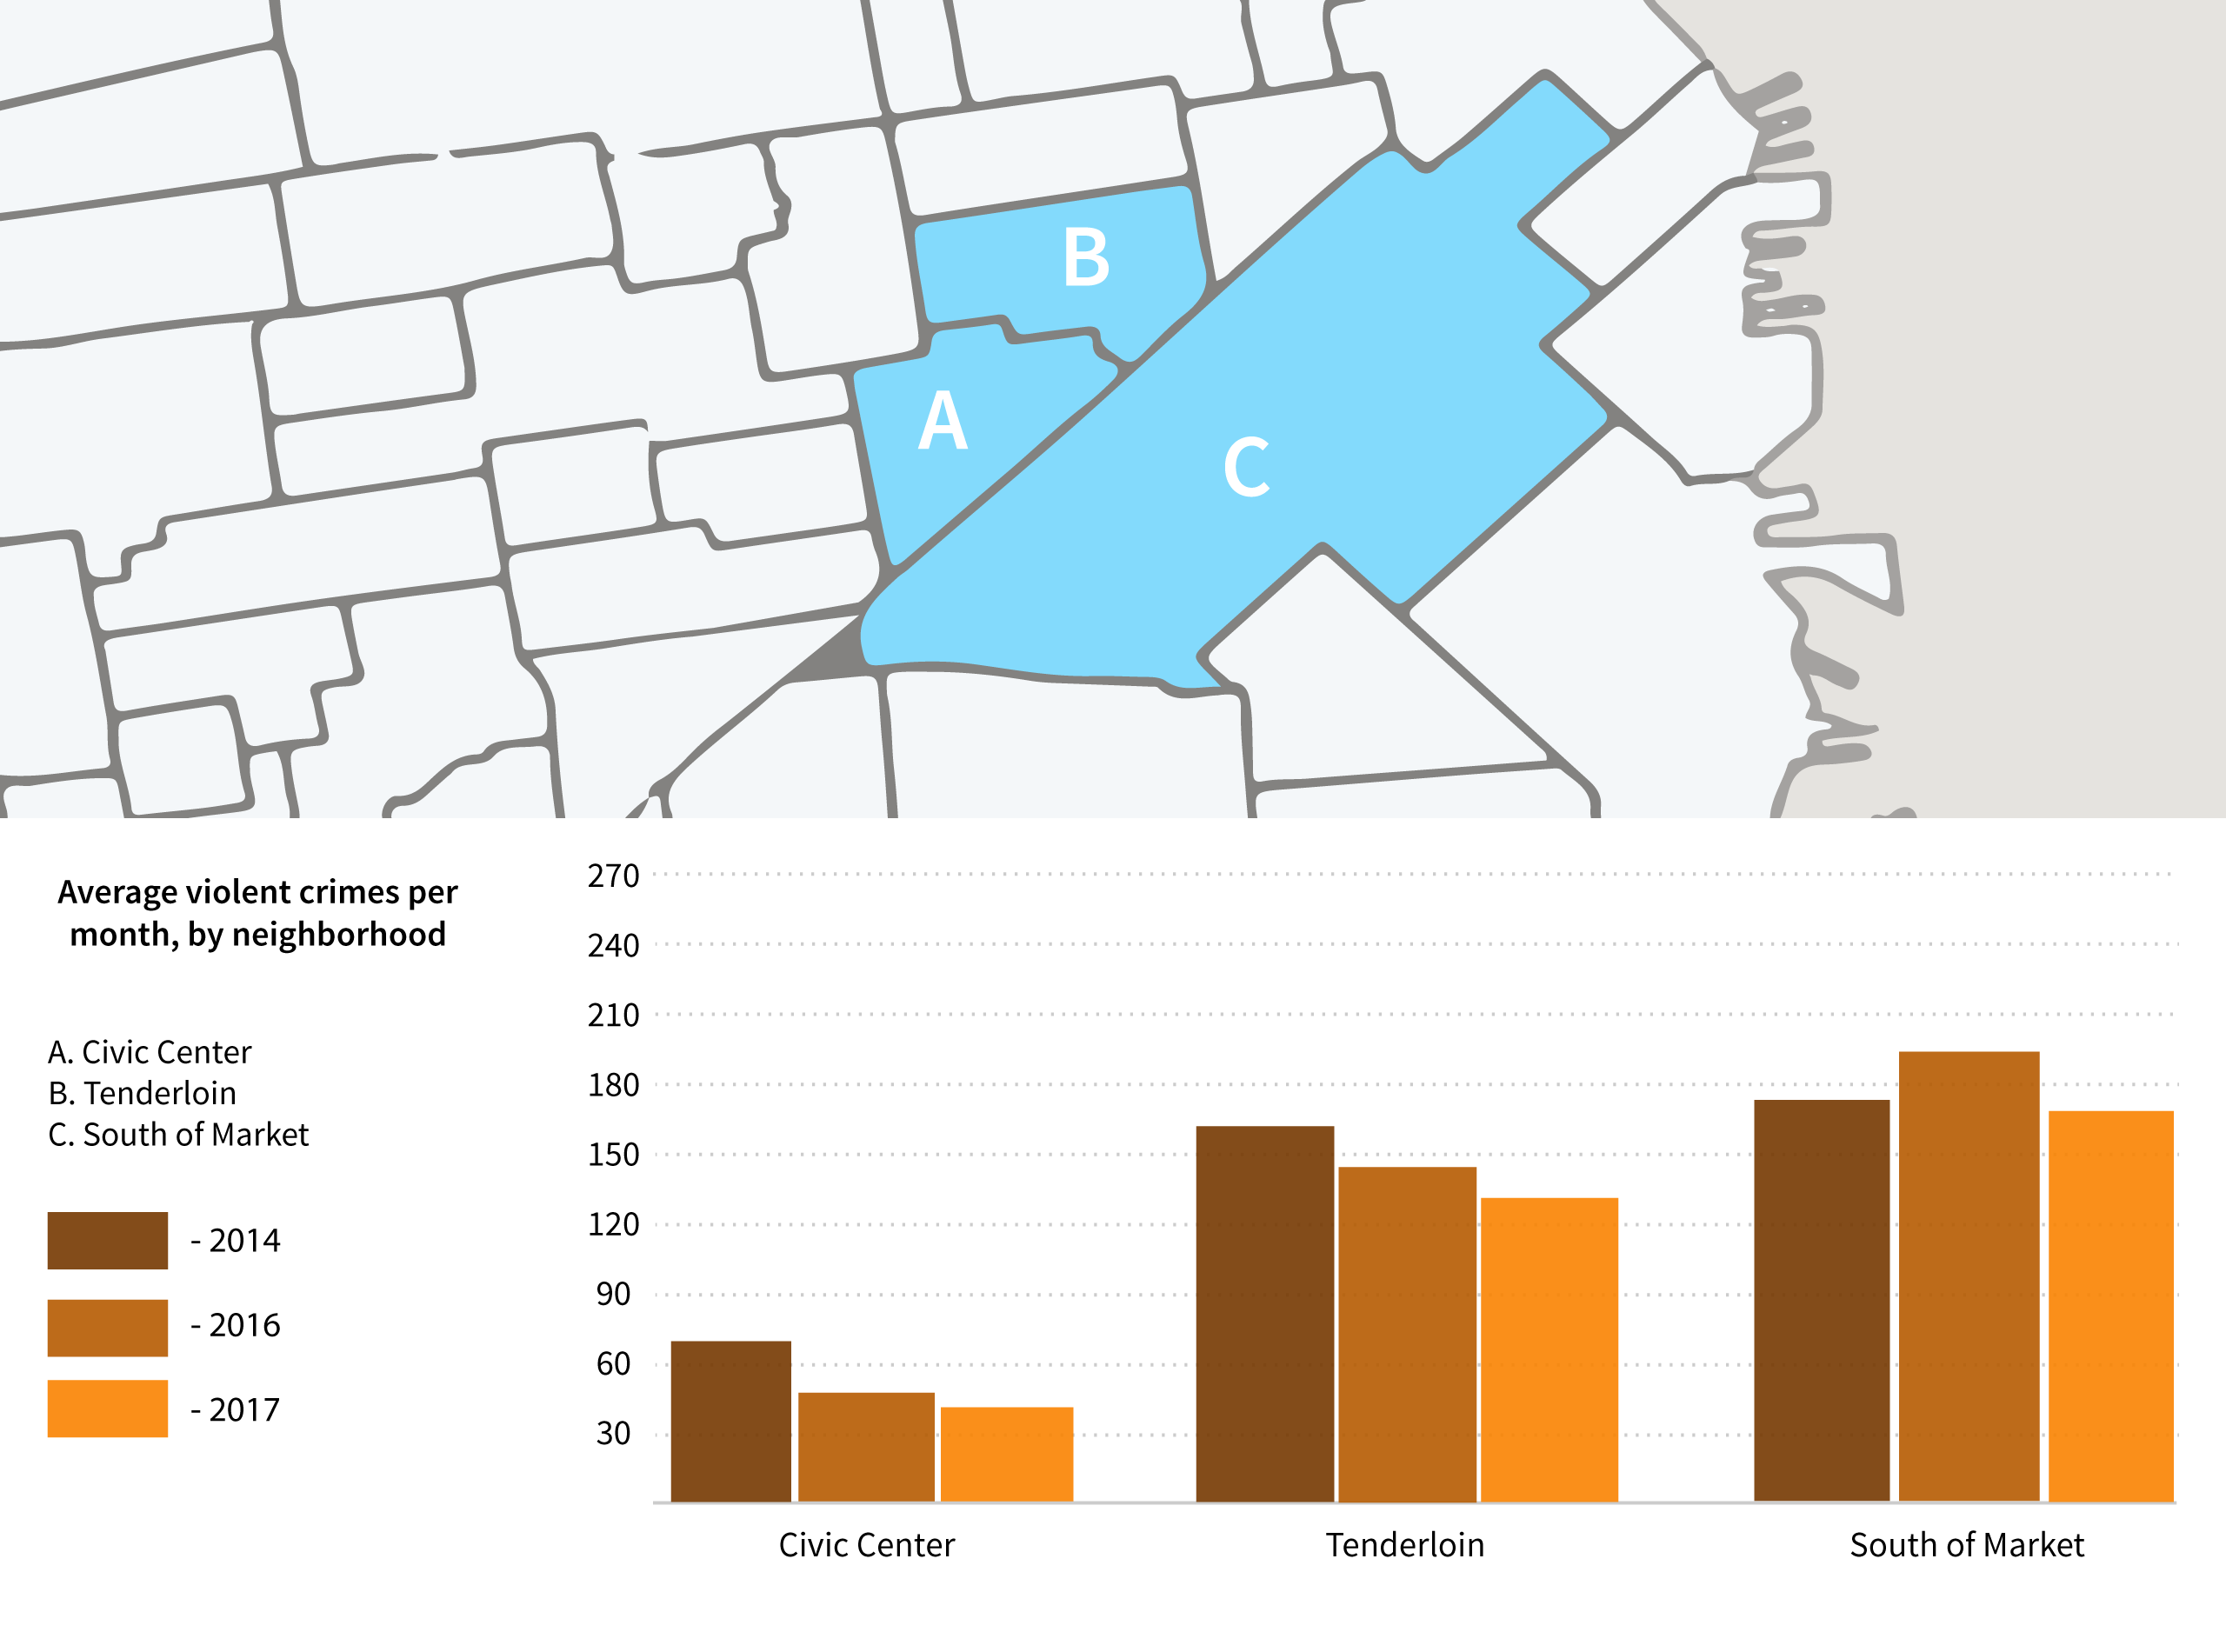
The Tenderloin and SoMa neighborhoods, as marked in the map below, were down 17 percent and 13 percent percent, respectively.
By the numbers, that’s around 25 fewer violent incidents per month in each neighborhood this year versus the average month last year. Civic Center, which on this map includes chunks of the Tenderloin, SoMa and Hayes Valley, was also down by around 10 violent incidents per month on average.
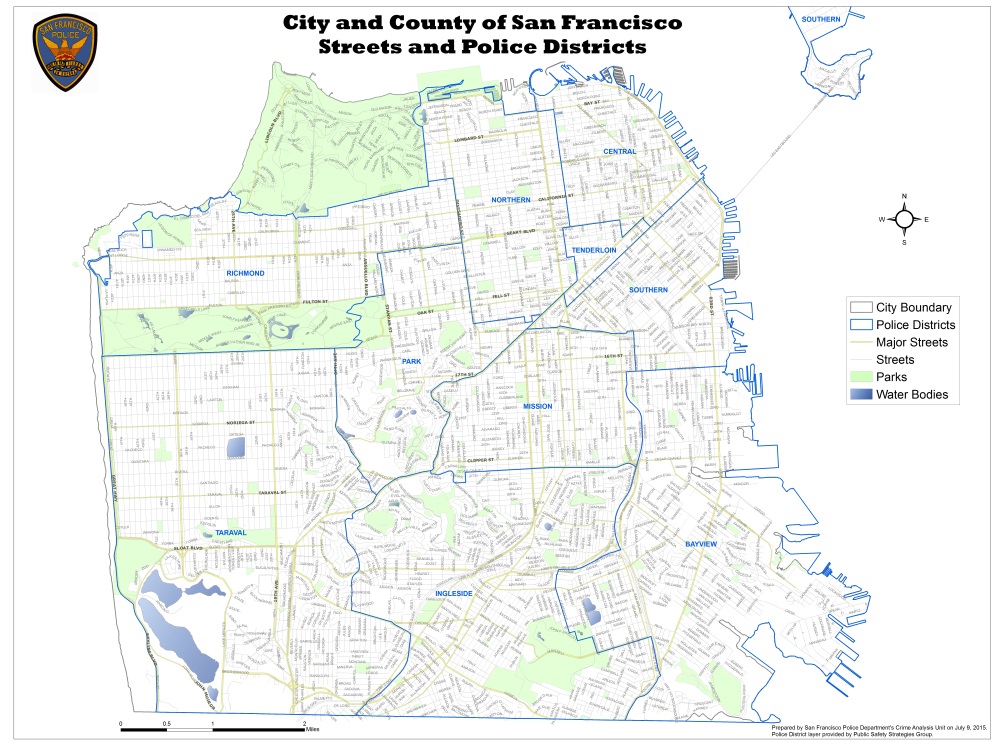
We checked with the SFPD to compare against its internal analysis. The department provides citywide numbers, and regional trends based on its ten police districts.
Violent crime is down across San Francisco so far in 2017, according to SFPD spokesperson Officer Grace Gatpandan, with a decrease of 5 percent in January followed by another decrease of 7 percent in February.
The department's Tenderloin Station, which covers the Tenderloin, most of Mid-Market north of Mission Street in SoMa, and portions of Civic Center, experienced a decrease in violent crime of 9 percent in January. February district numbers are not yet available.
Meanwhile, the department's Southern Station, which covers other parts of SoMa but extends further south and west than the boundaries we used, actually saw a violent crime increase in January of over 20 percent. (We believe the difference is mostly due to our SoMa boundary including the southern streets of the Mid-Market area. More details are in the methodology section at the end of the article.)
What’s happening up Market Street and to the west?
By last month, we were noticing what seemed like an uptick in violence around the Haight and Castro neighborhoods.
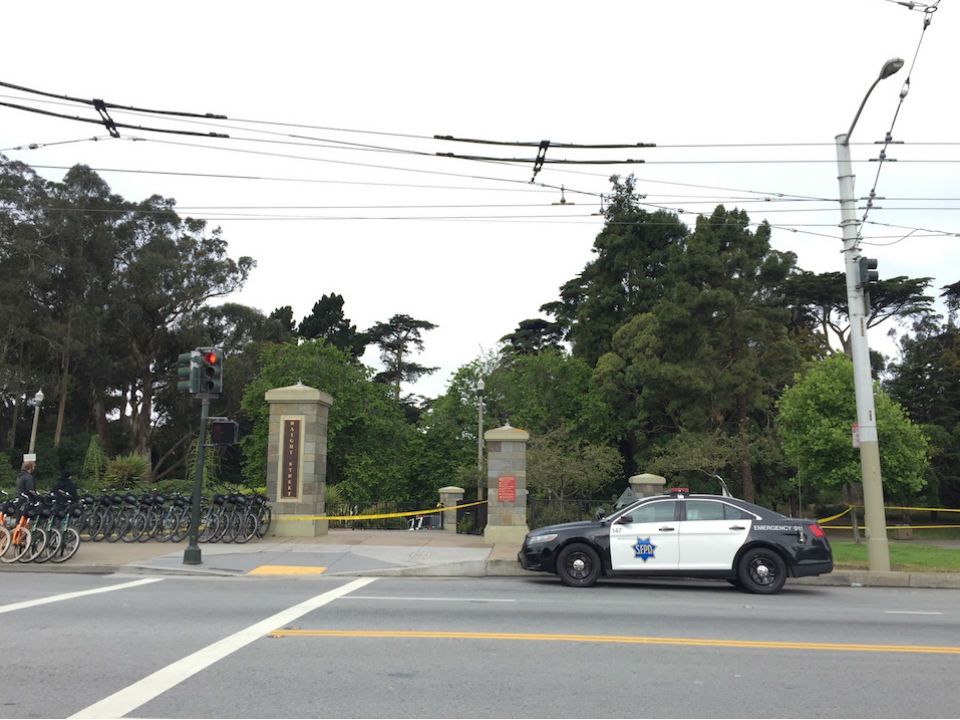
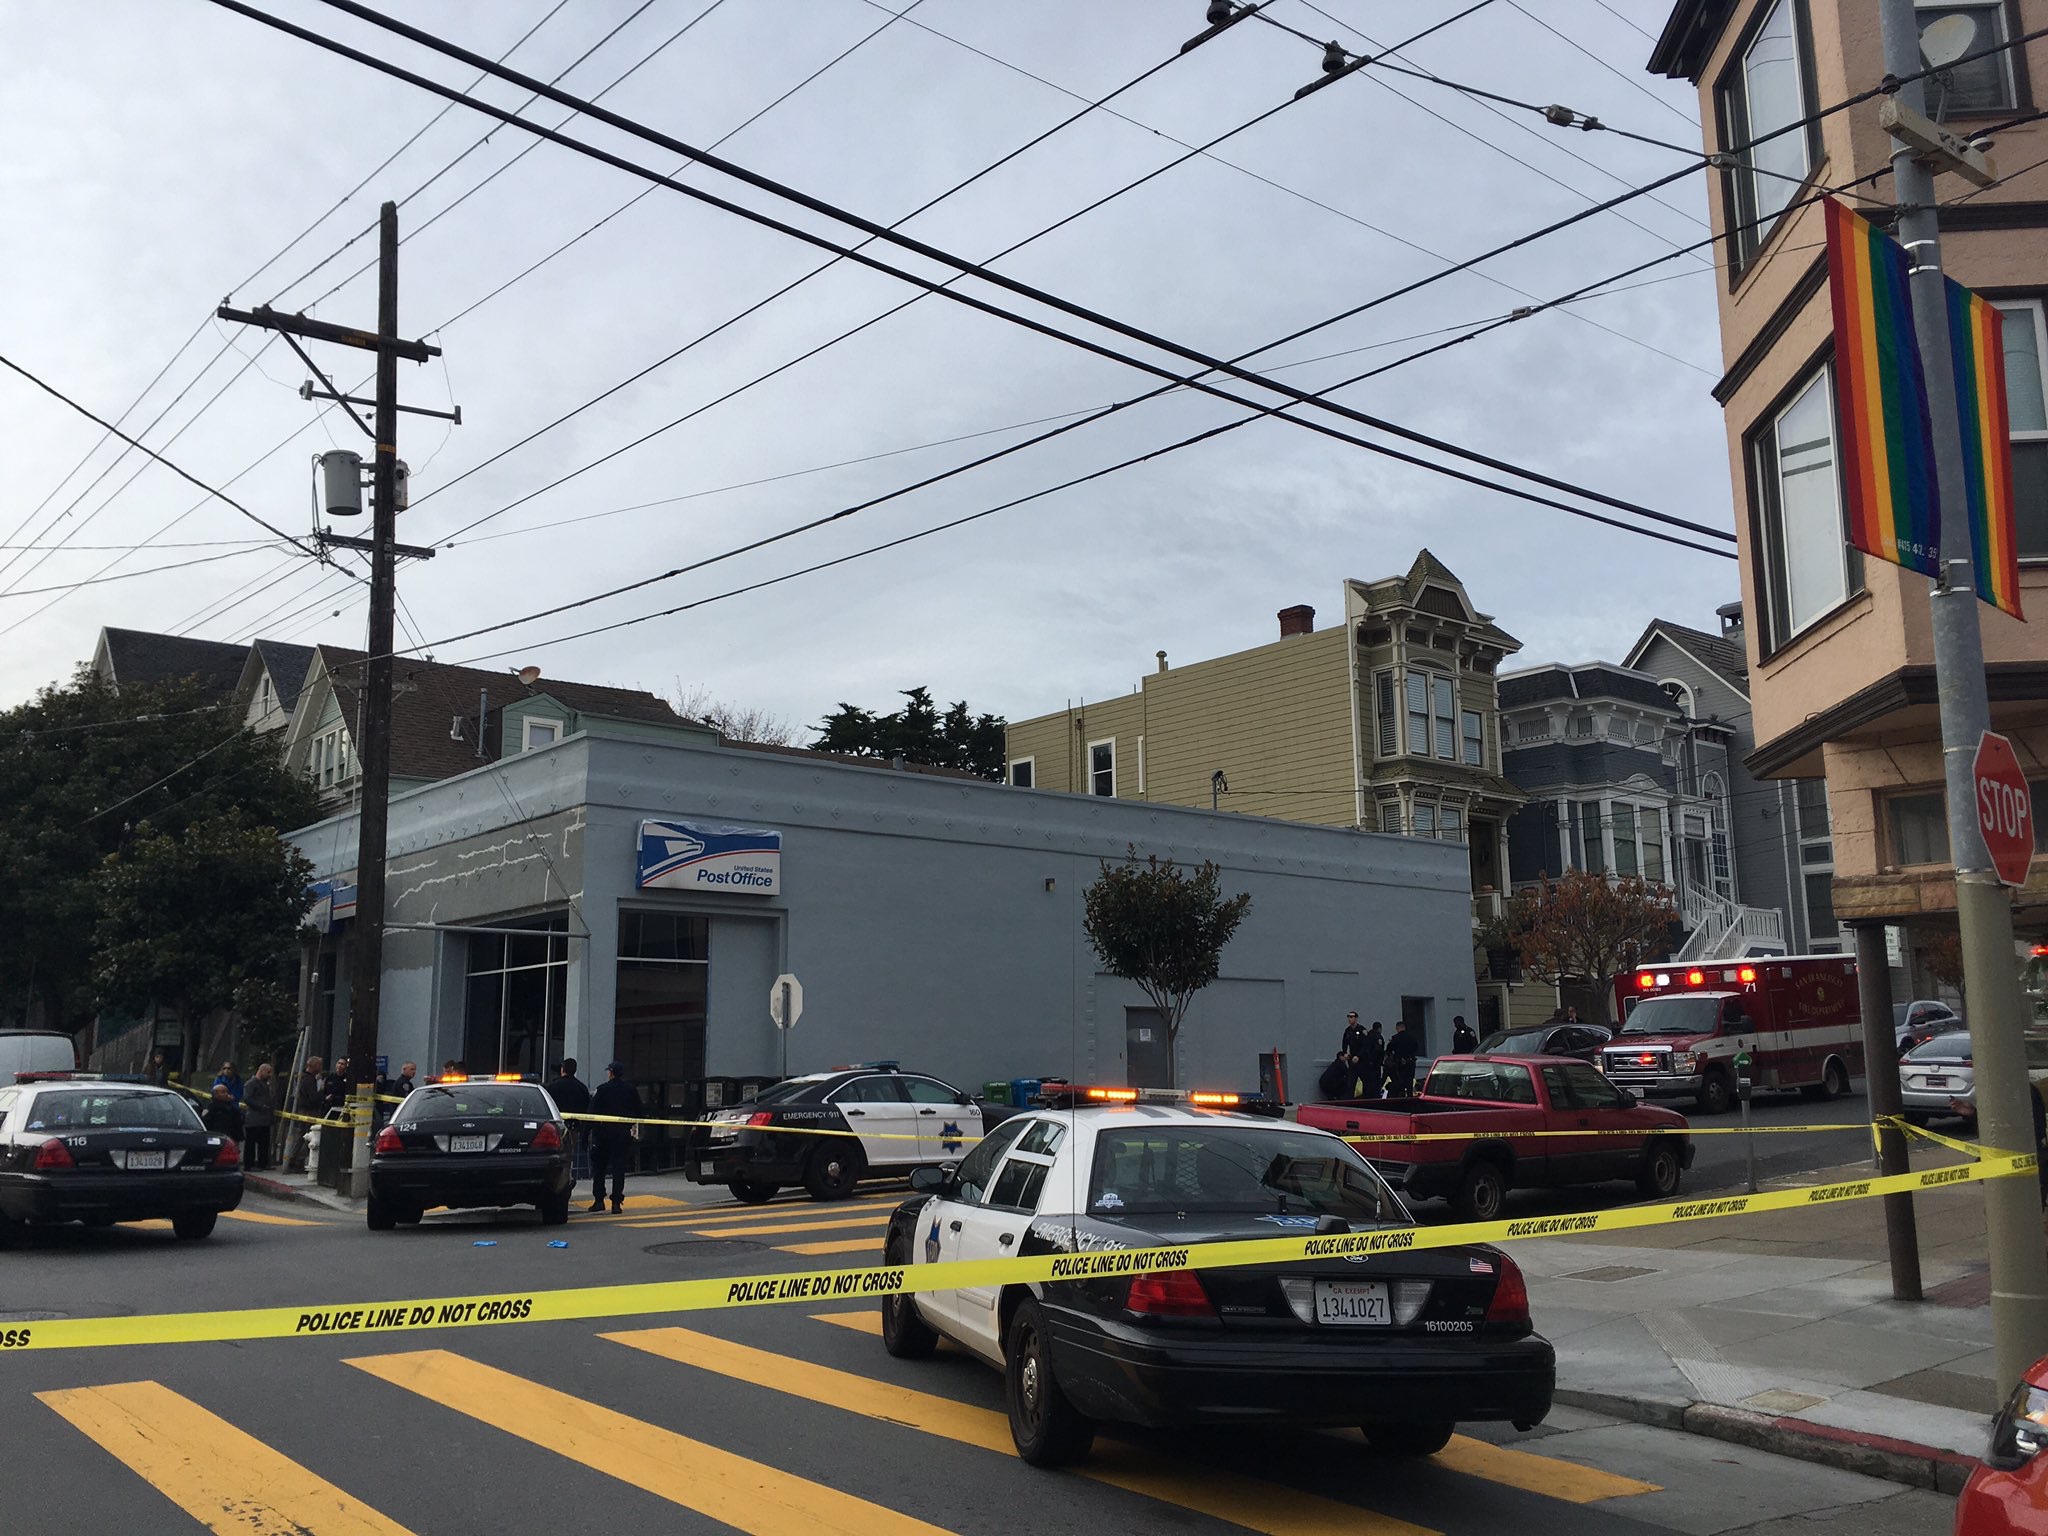
For example, there were three armed robberies around the Panhandle just in January—compared with nine total last year. We also found ourselves covering major incidents like the February 11th skateboard attack near Haight and Stanyan, and a shooting on Fell near Masonic around the same time.
Over in the Castro area, Duboce Triangle saw 12 assaults in January, versus six in December, and six the previous January, according to a presentation by Park Station officers at a mid-February community meeting.
As with most of the city, there has still been good news about crime for these neighborhoods—property crimes have showed declines versus last year, as we've reported. And Officer Gatpandan with the SFPD says that Park Station, which also covers parts of the Inner Sunset and the sleepy neighborhoods around Twin Peaks, has seen a 17 percent drop in violent crimes overall.
So why the jump in violent crimes in certain neighborhoods?
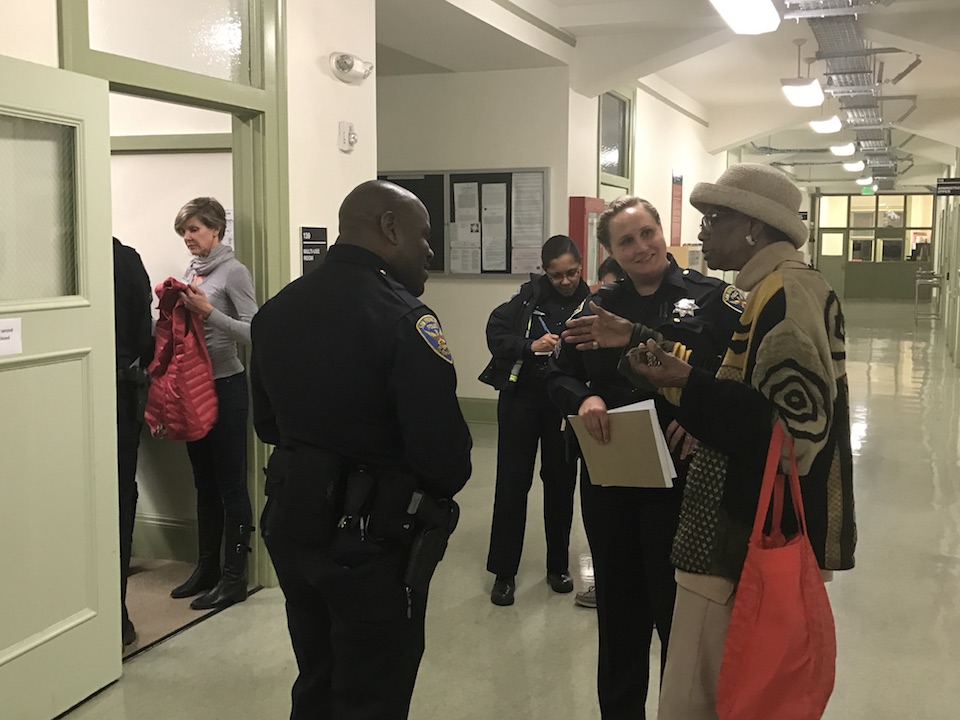
Hoodline attended a crowded community meeting in mid-February, held north of the Panhandle, where neighbors singled out a local business they said was a source of drug dealing, assaults and shootings. The police at the meeting didn’t seem so sure, and asked the neighbors to provide more evidence.
Meanwhile, many Duboce and Castro residents regularly point to members of the local homeless population as the culprits. And over at Haight and Stanyan, locals are familiar with the recurring violent incidents over the years, often associated with certain members of Golden Gate Park's transient population.
One trend to watch is the shift between the mid-Market area and adjacent neighborhoods. Since the mid-Market area began to be redeveloped years ago, existing populations of homeless and at-risk persons have been pushed to adjacent areas, as the Chronicle detailed in this 2014 article.
"When you concentrate on an area," explained then-SFPD Chief Greg Suhr in the article, "you get displacement into adjacent areas, and the focus becomes there."
It's possible that ongoing development and anti-homeless enforcement in the Mid-Market area could (still) be pushing homeless and at-risk people into other neighborhoods — up Market, to Castro, to the Haight, and beyond.
We've also looked for other trends in the incident reports, examining month to month averages in all of the neighborhoods mentioned above, to see if we could detect any seasonal variations. We didn't find much. For example, while the Castro also had high levels of violence in January and February of 2016, the adjacent Duboce Triangle had much lower ones than this year.
As part of this story, we worked with our partners at KGO to investigate the numbers. Among the findings: neither the skateboard attack nor shooting involved homeless people, according to reporter Kate Larsen's interviews with police.
Here's more, including thoughts from Hoodline's own Walter Thompson, who has been covering Park Station crime issues here for years. Stay tuned for more updates on these numbers in the future.
How we analyzed the data
We looked at the incident report data sets for 2014, 2016 and 2017 through February. (The city doesn’t provide 2015 in the same format, so we ignored that year.)
Since there are a wide range of neighborhood boundary maps floating around, we stuck with the one used by the city on its Property Information Map site, which you can see here. It includes 118 neighborhoods, which gives us a granular way of dividing up locations around the city (even if the boundaries don't always fit what locals, including Hoodline staffers, think of as the city neighborhoods).
We used the official violent crime categories provided by the police in the datasets, including assaults, robberies, sex crimes, kidnappings, driving under the influence, and suicides. The vast majority of violent crimes in the data sets are assaults, with robberies a distant second.
To help us see long-term trends, we averaged out crime rates per neighborhood between months. (Here's our spreadsheet of the yearly averages by neighborhood.)
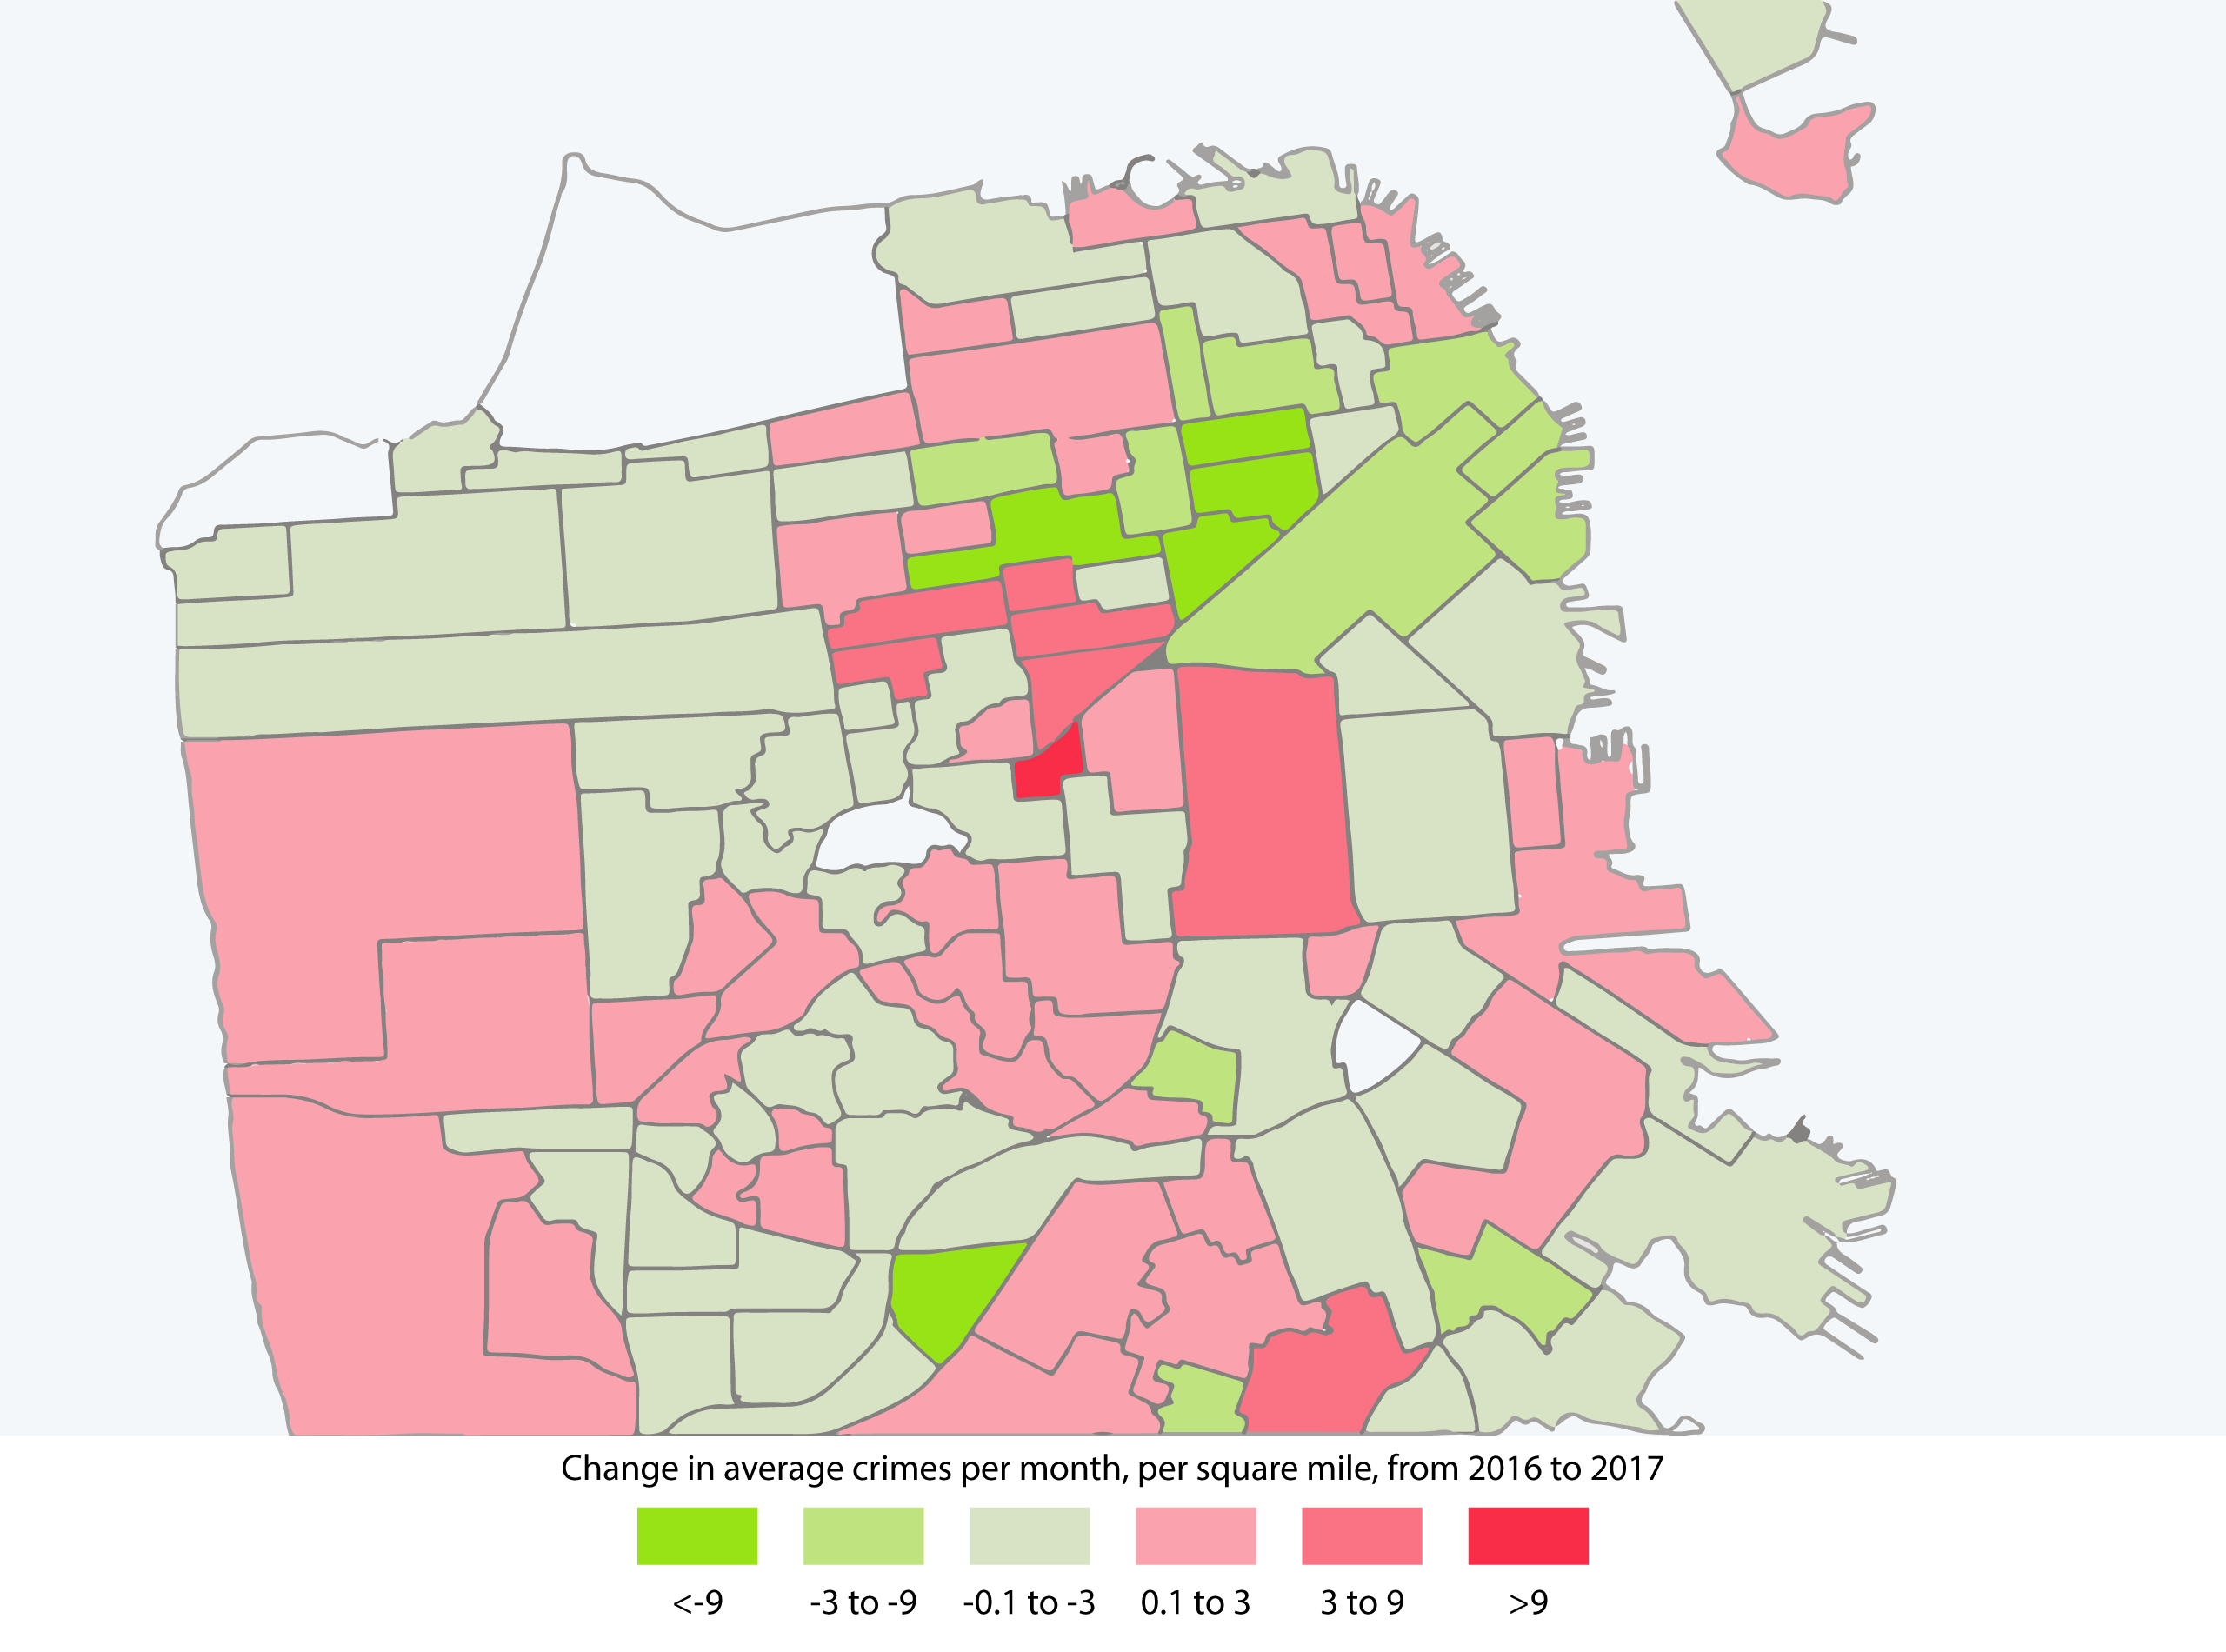
Because each neighborhood is a different size and shape, we also calculated violent crime monthly averages per square mile, which shows us the density of crime per neighborhood area in the red and green map.
Our stats also differ at least slightly from what the SFPD shares from time to time. The department offers stats occasionally at the police-district level—each of the ten areas is much bigger and differently shaped than the 118 neighborhood boundaries we looked at. The police also use an internal tool to track crime that can include updates to classifications after initial incident reports come in, that we don't have an easy way to compare against incident reports. Treat this analysis as one snapshot in time, to which other snapshots still need to be added.


