
The Office of the Controller released results from its biennial survey earlier this week that gave letter grades to a number of city services, including safety, transportation and government performance. It’s the fifteenth such iteration of the City Survey.
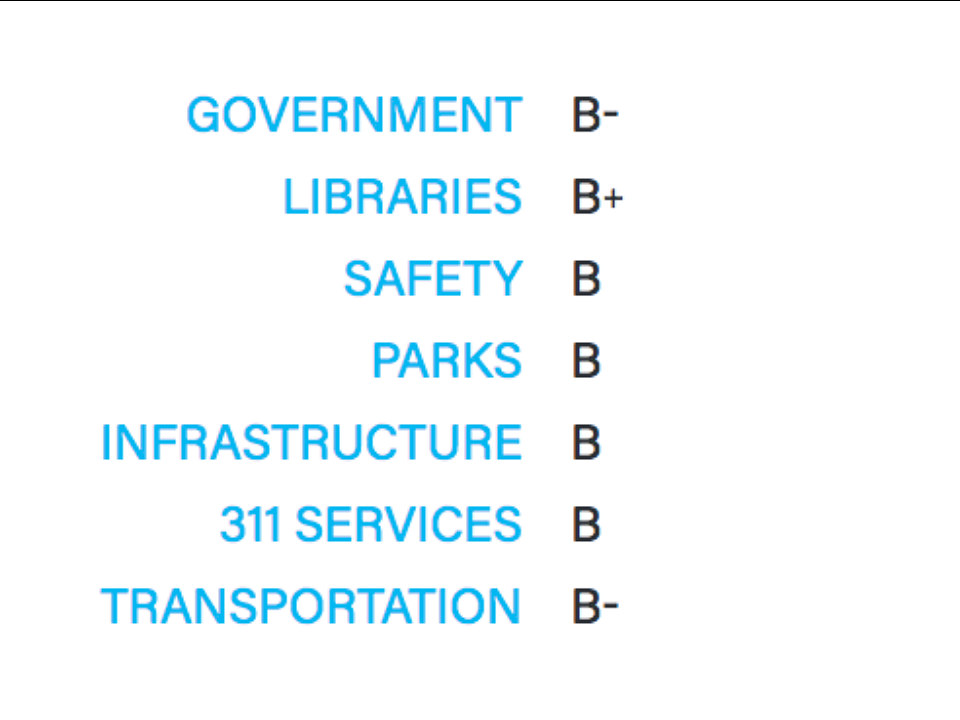
Once the results were tallied, San Franciscans gave the city a 'B' rating.
More than 2,000 residents who reflect San Francisco’s diversity completed a 2017 survey questionnaire. The Controller's office uses their responses to track how effective and efficient departments are over time.
What Did We Learn?
The 2017 City Survey confirms what some may feel like they already know: sidewalk conditions are worse, taxi use is down, ride-hailing is up, and many feel less safe than they did two years ago (see the complete scorecards here).
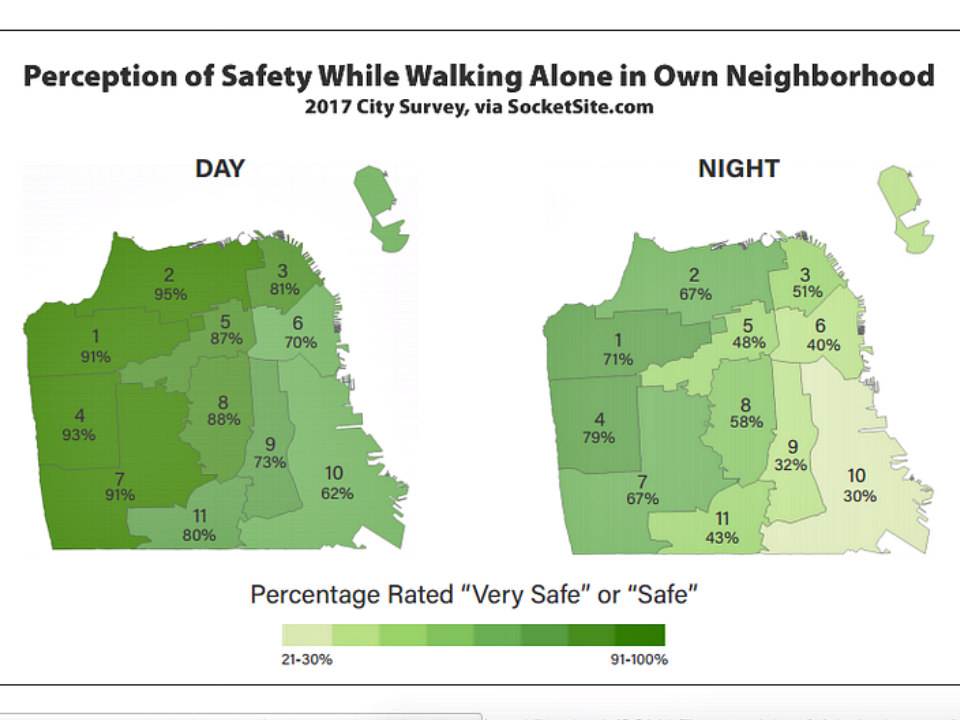
Citywide, feelings of safety have dropped, with residents of Districts 6, 9, 10 and 11 feeling the least safe. Those living in District 4 reported feeling safer at night in their district than respondents in Districts 6, 9 and 10 reported feeling safe during the day.
The library system received the highest ratings among any city service, while Muni received the lowest overall ratings from respondents. District 8 residents dished out the lowest ratings to Muni, slamming the agency for things like frequency, reliability of service and crowd management.
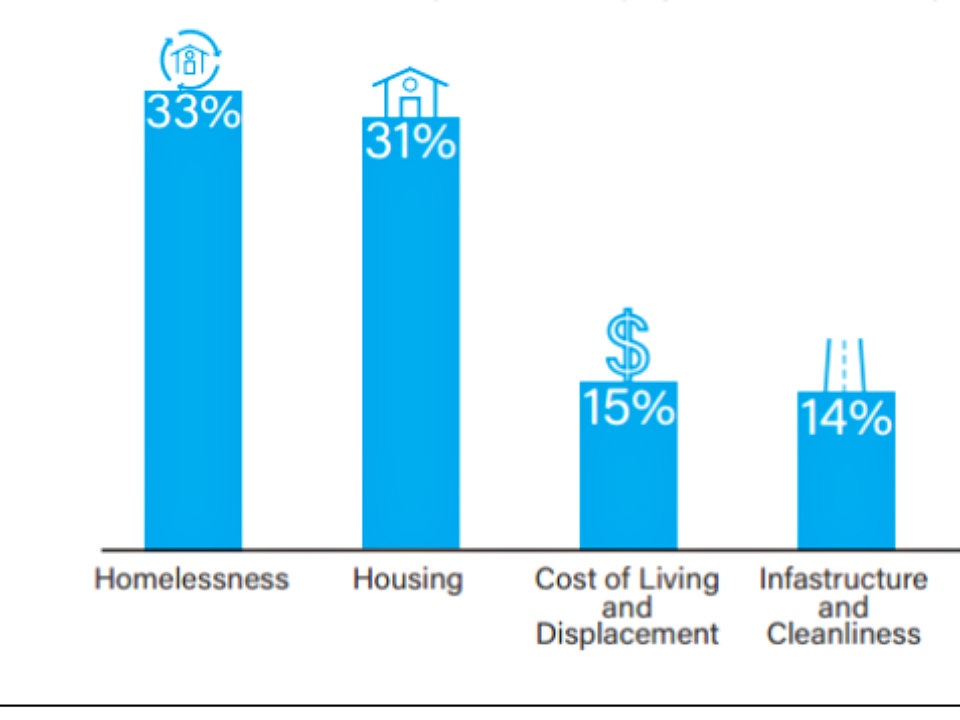
Homelessness and housing were the two biggest concerns the survey identified.
Why Does It Matter?
Although it’s tempting to look at the best and worst scoring city departments and compare them, Celeste Berg, a city services auditor with the controller’s office, said that’s not the survey’s intention; it’s about tracking trends within individual departments over time.
The City Survey is just one of many pieces of performance information that independent consultants and the controller’s office objectively compile. “We monitor the efficiency and effectiveness of city services,” Berg told Hoodline. “That’s our main goal.”
“In the past, it was about 150 pages,” said Berg, laughing. She said 2017’s 26-page report is intended to be more digestible to both the general public, elected officials and department heads.
Berg added that the City Survey is just one piece of information that decision-makers consider and that the report doesn’t directly translate into specific initiatives or bond measures. That said, she said the survey’s most recent findings support previous evaluations indicating that there's a geographic disparity in how the Rec and Park Department serves city residents.
Last fall, as part of an effort to mitigate deficiencies in services to disadvantaged communities, Rec and Park adopted 17 equity metrics designed to target services and resources to low-income neighborhoods, Berg said.
“This is one good example,” she said, although anecdotally, Berg said she’s heard of other departments such as the Library, SFMTA and Public Works also using City Survey findings to hold up against their own evaluations and surveys.
What letter grade would you give the city?