Despite receiving the lowest park maintenance score once again, District 11 parks advocates and city representatives hope a wave of recent parks projects will boost the district’s score in the future.
An annual report that ranks the city’s maintenance levels of parks based on evaluations by the Recreation and Parks Department and the Controller’s office shows improvements in the average maintenance score across the city but lagging scores in two southern supervisorial districts.
In the report published on December 5th, District 11 remained at the bottom of the rankings, while District 10 placed second to last.
Low maintenance scores for parks in Districts 10 and 11 are nothing new. The two districts have traded last place every year since the Controller’s Office began publishing maintenance reports in 2005.
In District 11, a wave of recently-completed and soon-to-come improvements on low-rated parks and playgrounds may boost the score in coming years.
Cathy Mulkey-Meyer, a legislative aide for District 11 Supervisor Ahsha Safai, said current and coming capital improvements will help the district rise in the rankings next year.
“The report is incomplete because it doesn’t show the significant capital improvements in various phases of construction,” Mulkey-Meyer said. “By 2019, District 11 will not be at the bottom of the survey.”
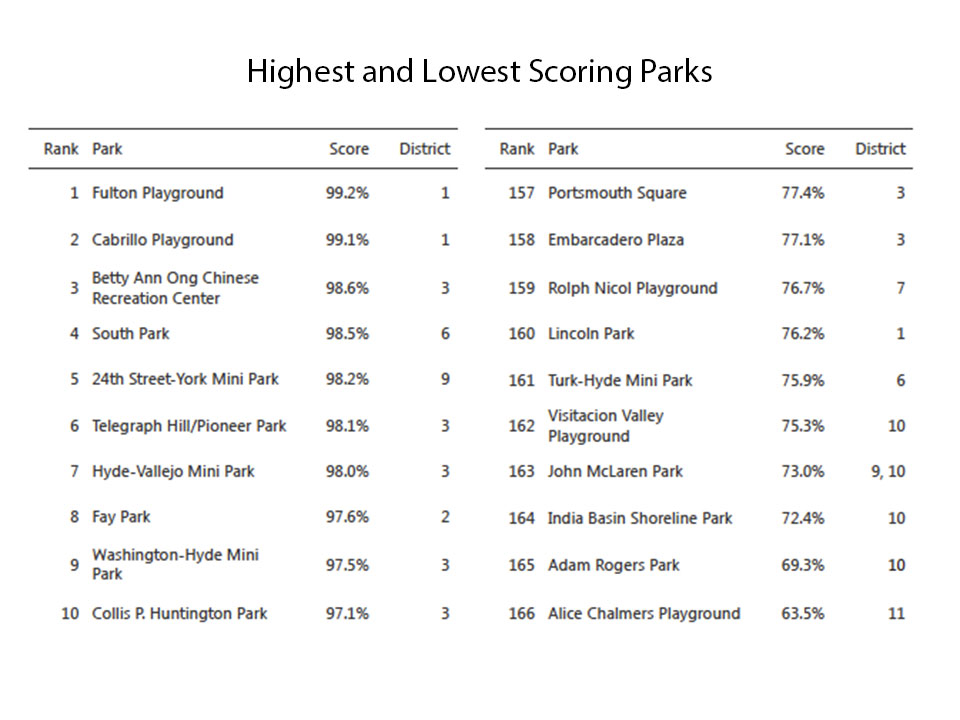
In the coming year, improvements to Alice Chalmers Playground, Crocker Amazon Park, Excelsior Playground, McLaren Park and Merced Heights Playground will boost the the district’s score, said Mulkey-Meyer.
“The Department is encouraged that the citywide average park score has increased, going from 85% in 2015 to 86% in 2016 and now to 88% in 2017,” according to RPD spokesperson Connie Chan.
The worst-maintained park in the city is Alice Chalmers Playground, which received a 63.5 percent rating. John McLaren Park, the city’s second largest park which is shared between Districts 9, 10 and 11, received a rating of 73 percent, the forth lowest in the city.
For the third year in a row, playgrounds remain the lowest-rated type of park in the system, with an overall score of 80 percent, according to the report.
Three play areas in District 11 and four play areas in District 10 were ranked among the worst maintained in the city.
In 2016, parks advocates fought to add equity metrics to Proposition B, a parks funding bill that created a more stable funding stream for parks maintenance, to help combat the department’s massive deferred maintenance bill.
This year’s report covers the first full year that the department followed the equity metrics, “which require RPD to formally consider and measure equity in the allocation of its resources.”
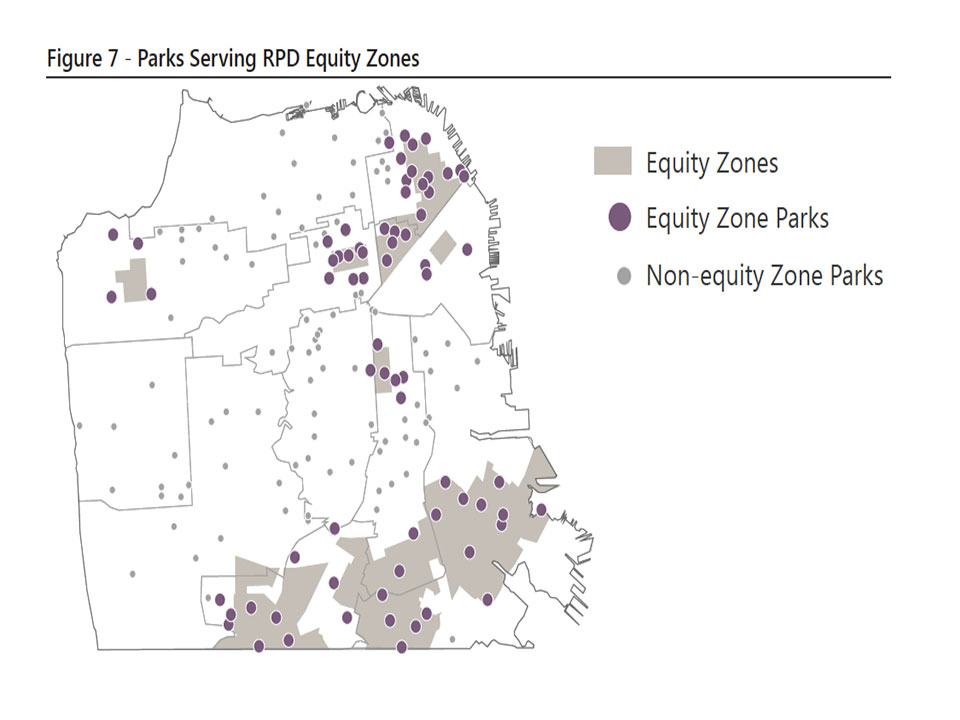
Although portions of District 10 and 11 are included in the department’s equity zones, the parks scores have not improved drastically yet.
Linda D’Avirro, a former chair of the Parks, Recreation and Open Space Advisory Committee, said she was “very disappointed” by the lack of progress shown in the report.
While capital projects will boost District 11’s score in the coming years, the improved scores may not last if new facilities aren’t maintained properly, she said.
To solve this problem, D’Avirro said she hopes to see more funding for maintenance work in conjunction with the coming capital improvements.
“If maintenance occurs at proper levels, it lengthens the life of a facility,” she said.
This article was published in partnership with the Ingleside-Excelsior Light.


